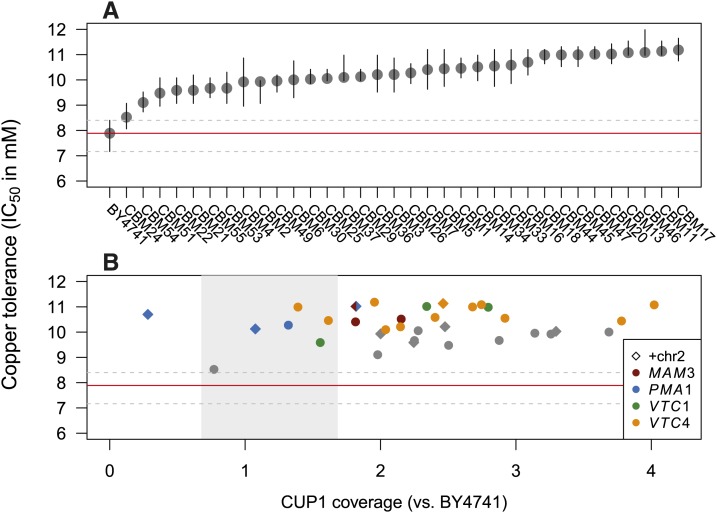
Figure 2.
Copper tolerance across 34 copper-adapted lines (“CBM lines”). (A) Lines are numbered based on the date the mutant line was isolated following exposure to copper. The order of CBM lines in other graphs is based on the order of copper tolerance depicted here, which gives the IC50 after 72 hr of growth in deep-well boxes (bars represent 95% confidence intervals). Tolerance of BY4741 (the ancestor) is indicated by the horizontal red line with its confidence interval indicated by dashed gray lines. (B) Copper tolerance of each CBM line is generally high, regardless of the CUP1 copy number (x-axis, accounting for duplication of chrVIII). The absence of a correlation between CUP1 level and copper tolerance is due to the existence of additional mutations in the CBM lines, particularly in the four genes that were mutated independently (colors). Gray shading shows the range of CUP1 observed among the BMN lines (see Materials and Methods and Figure 1C).

