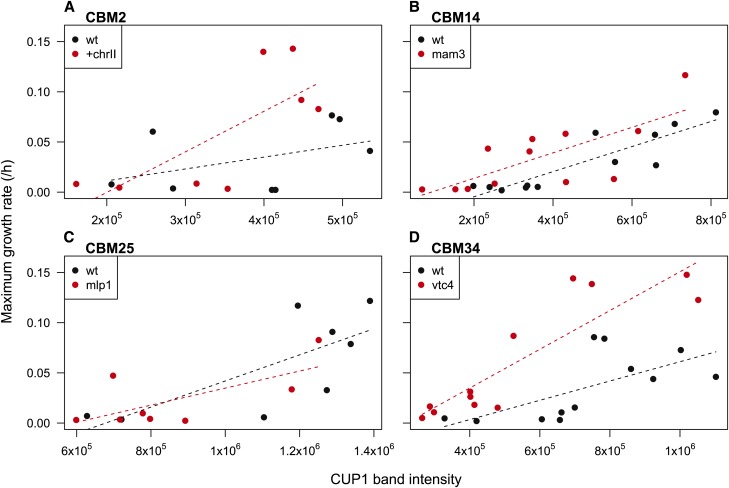
Figure 5.
Impact of mutations on growth of tetrad lines in YPD + 9 mM CuSO4. Dots indicate maximum growth rates for tetrad lines carrying (red) or lacking (black) the mutation of interest: (A) chrII aneuploidy in CBM2, (B) MAM3 in CBM14, (C) MLP1 in CBM25, and (D) VTC4 in CBM34. For each line, linear model fits were performed with maximum growth rate as the response variable and CUP1 copy number and the allele status of the other mutation as the predictors. All fits are plotted including interaction terms between CUP1 copy number and the other gene of interest, where MLP1 was used as the gene of interest for CBM25 in C (no difference is seen when using ENA5).

