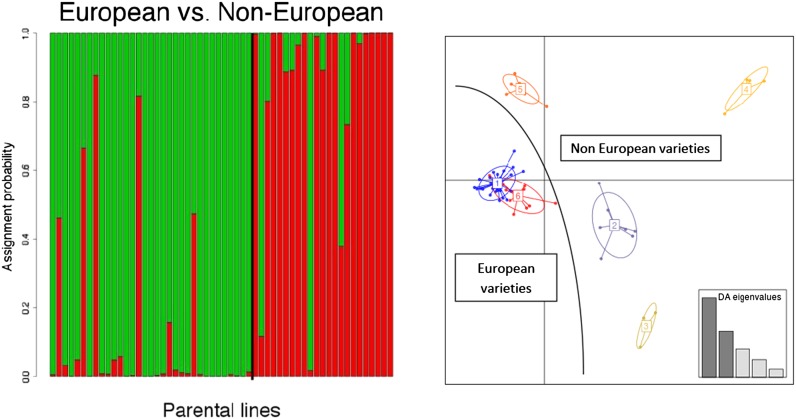
Figure 2.
Left: Estimated population structure in parental lines. Each individual is represented by a vertical line, which is partitioned into two colored segments that represent the individual’s estimated membership fractions in two clusters. Black vertical line separates European lines (mainly green) from non-European lines (mainly red). Right: Projection of individuals onto discriminant axes with groups represented by different colors: six groups related by pedigree.

