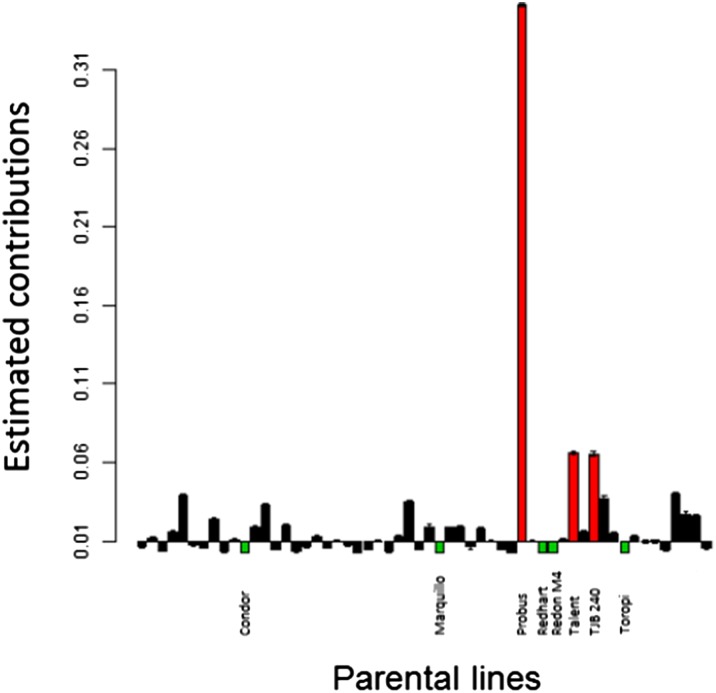
Figure 3.
Genome-wide estimates of contribution for each parent. Maximum credible interval 0.002. Above bars represent the contribution higher than the median contribution while below bars correspond to contributions lower than the median. Parents with the highest contribution are in red and those with the lowest in green.

