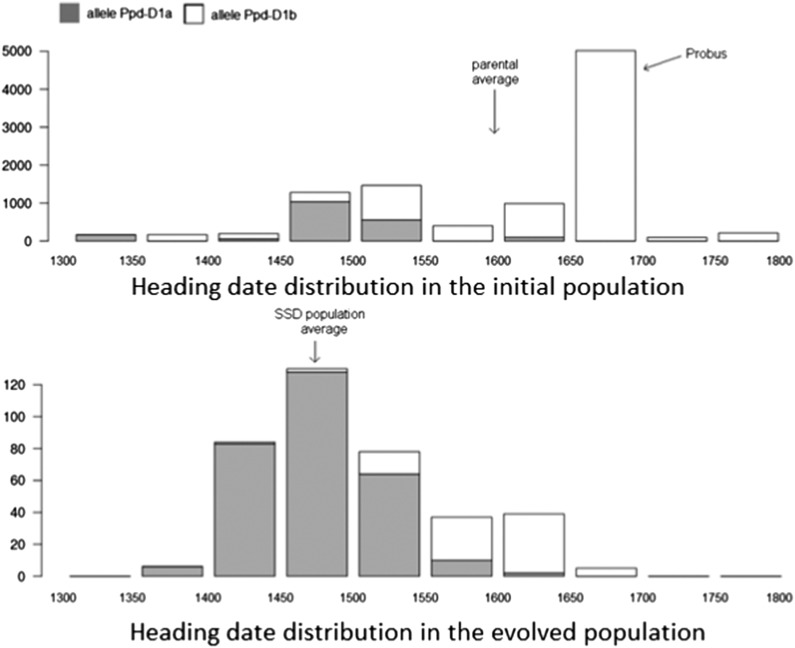
Figure 6.
Distributions of heading date (in degree days) estimated by the Bayesian method. Top: Initial population. Bottom: Evolved population. Proportion of individuals in each class: shaded bars indicate photoperiod-insensitive allele (Ppd-D1a) and open bars indicate photoperiod-sensitive allele (Ppd-D1b).

