Fig. 1.

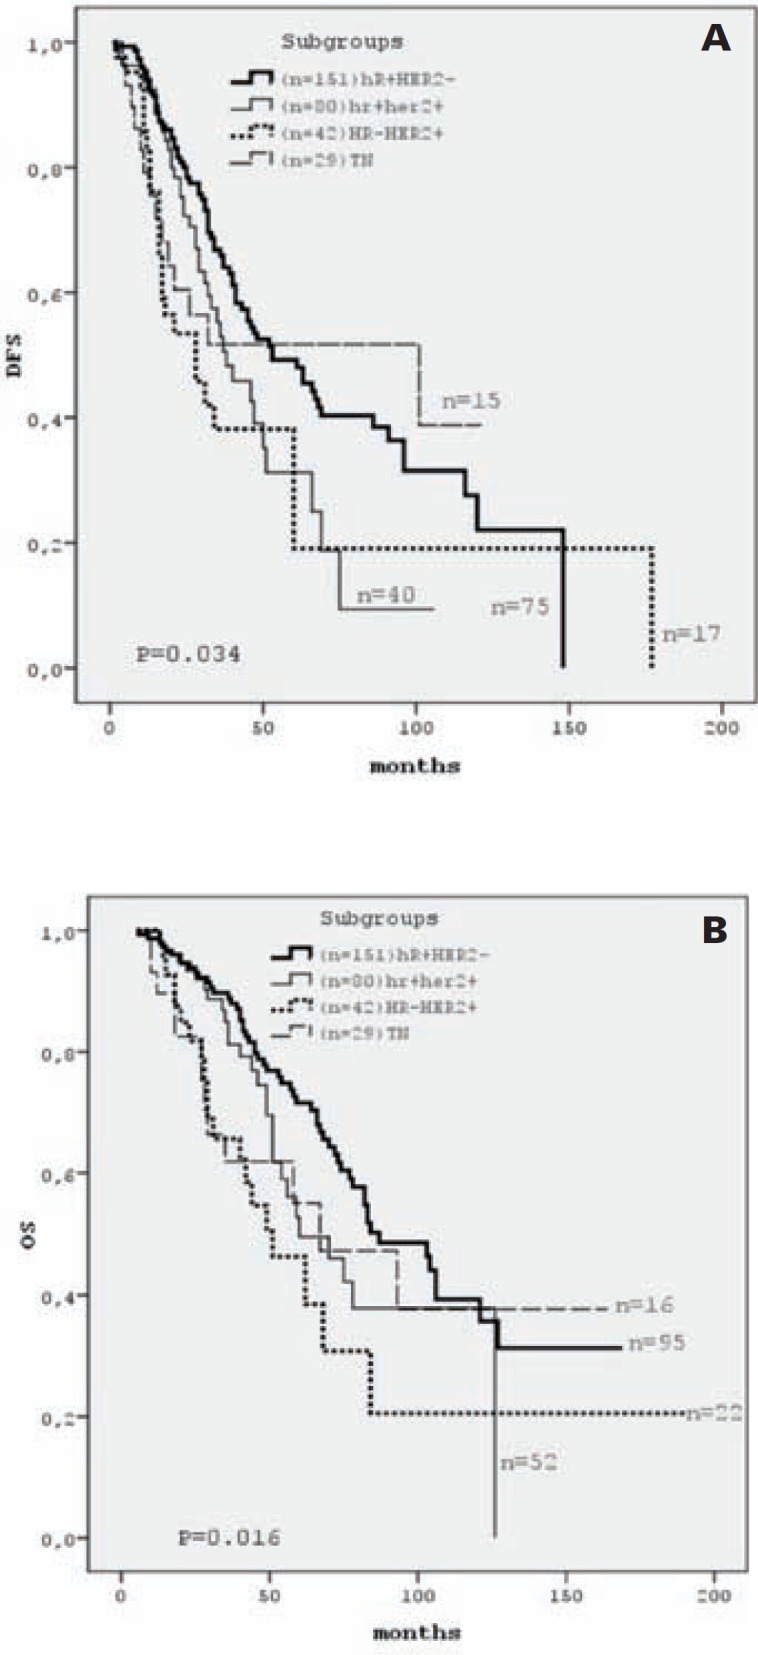
DFS (A) and OS (B) curves by tumor subgroup. HR = Hormone receptor, HER2 = human epithelial growth factor receptor 2, n = number of cases included at time 0 and number of cases still under observation at the end of the study.

DFS (A) and OS (B) curves by tumor subgroup. HR = Hormone receptor, HER2 = human epithelial growth factor receptor 2, n = number of cases included at time 0 and number of cases still under observation at the end of the study.