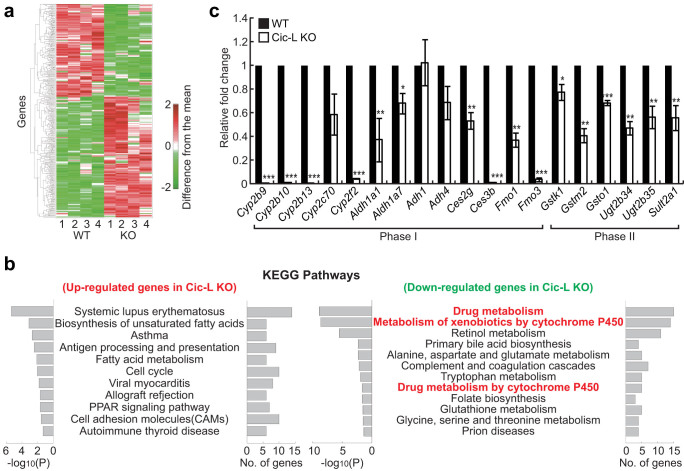
Figure 2. Down-regulation of drug metabolism genes in Cic-L-/- liver.
(a) Heat map showing up- and down-regulated genes in Cic-L-/- mice (KO) at P18, compared with WT. The numbers in x-axis denote four replicates used in WT and KO. Red and green colors represent increase and decrease in expression levels of the genes, respectively, from the mean expression levels of the eight replicates. Color bar, gradient of log2-difference of the intensities from the median intensities. (b) KEGG pathways significantly represented by the up- and down-regulated genes in Cic-L-/- liver. The significance was represented by -log10(P) where P is the enrichment P-value obtained from the DAVID software. The number of the up- or down-regulated genes involved in each pathway is shown. (c) qRT-PCR analysis for levels of nineteen phase I and phase II drug metabolism genes in livers from 18 day-old WT and Cic-L-/- mice (n = 4~5 per each genotype). *P<0.05, **P<0.01, and ***P<0.001. All error bars show s.e.m.

