
Figure 4. Changes in levels of several hepatic transcription factors and proinflammatory cytokine genes in liver of Cic-L-/- mice at P18.
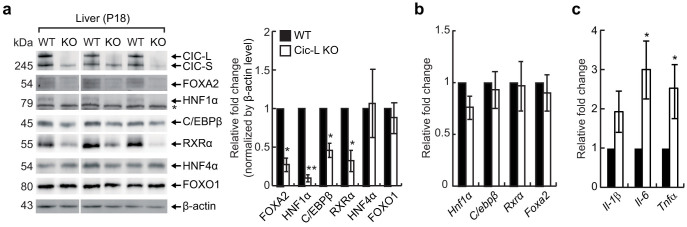
(a) Western blot image showing the decrease in FOXA2, HNF1α, C/EBP1β, and RXRα protein levels in Cic-L-/- liver at P18. The right panel is a bar graph for quantitative analysis on levels of hepatic transcription factors based on Western blot image. The asterisk indicates non-specific bands. *P<0.05 and **P<0.01. All error bars show s.e.m. (b) qRT-PCR analysis of Hnf1α, C/ebpβ, Rxrα, and Foxa2 expression levels using liver total RNAs prepared from 18 day-old WT and Cic-L-/- mice (n = 5 per each genotype). All error bars show s.e.m. (c) qRT-PCR analysis of Il-1β, Il-6, and Tnfα expression levels using liver total RNAs prepared from 18 day-old WT and Cic-L-/- mice (n = 7 per each genotype). *P<0.05. All error bars show s.e.m.