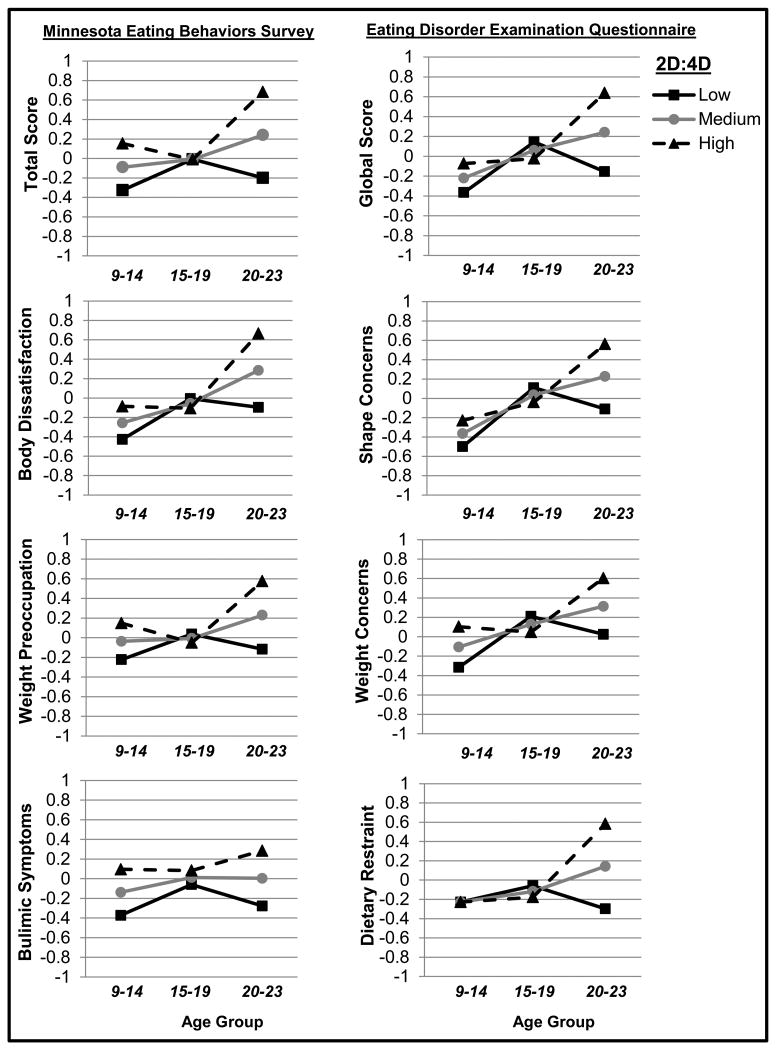
Figure 1. Predicted Levels of Disordered Eating by 2D:4D in Each Age Group.
Y-axis values represent predicted standardized disordered eating scores, adjusted for covariates (i.e., race/ethnicity and MSUTR old/new study variables). Early adolescence = ages 9-14, late adolescence = ages 15-19, young adulthood = ages 20-23. Effects are plotted at 1 standard deviation above the 2D:4D mean (i.e., “High 2D:4D” = low prenatal testosterone exposure), at the 2D:4D mean (i.e., “Medium 2D:4D” = average prenatal testosterone exposure), and 1 standard deviation below the 2D:4D mean (i.e., “Low 2D:4D” = high prenatal testosterone exposure).

