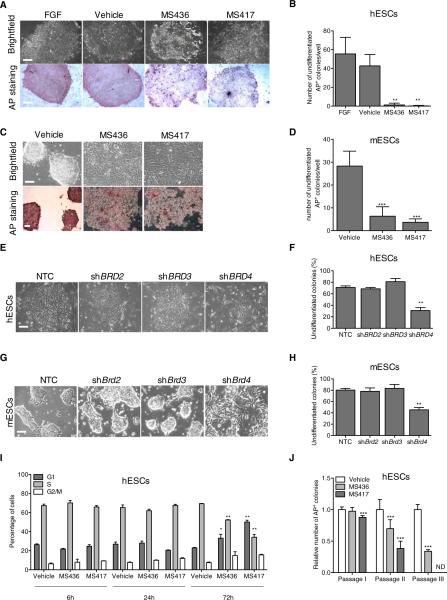
Figure 1. BRD4 Regulates ESC Identity.
(A) Representative bright field images (upper panel) of hESCs treated for 3 days with BET inhibitors compared to FGF- or vehicle-treated cells. Alkaline Phosphatase (AP) staining following treatment is shown in bottom panel.
(B) Quantification of AP-positive hESC colonies following FGF, vehicle, or compound treatment.
(C) Bright field images (upper panel) and AP staining (bottom panel) of mESCs treated with BET inhibitors for 3 days in the presence of LIF.
(D) Quantification of AP-positive mESC colonies following 3 days of compound treatment.
(E–H) Bright field images of hESC (E) and mESC (G) colonies following BRD2, BRD3, and BRD4 suppression. Percentage of undifferentiated hESCs and mESC colonies is shown in (F) and (H), respectively. NTC, nontargeting control.
(I) Cell-cycle analysis of hESCs following BET inhibitors treatment at the indicated time points as determined by FACS analysis.
(J) Self-renewal capacity of vehicle- and compound-treated hESCs passaged on mitotically inactivated MEFs in the presence of FGF as measured by AP staining. AP, alkaline phosphatase; ND, not detected. *p ≤ 0.05; **p ≤ 0.01; ***p ≤ 0.001. The scale bar represents 100 μm. Error bars represent SD. See also Figures S1 and S2.

