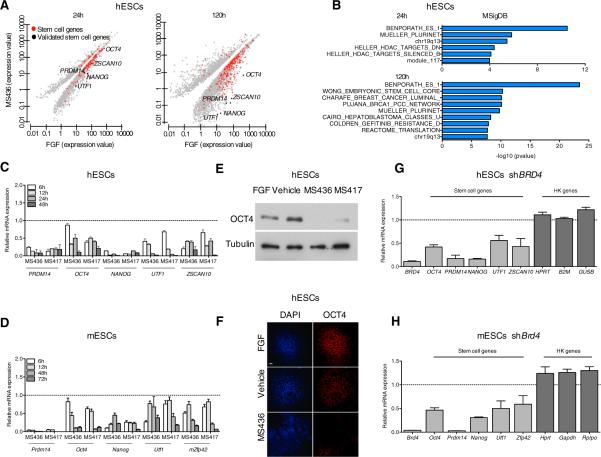
Figure 2. BRD4 Regulates the Expression of Stem Cell Genes.
(A) Scatter plots of gene expression at 24 hr and 120 hr in hESCs following MS436 treatment. Each point corresponds to a differentially expressed gene in compound-treated versus FGF-treated hESCs. Red dots indicate genes in the ESC gene categories (Table S1). Black dots represent stem cell genes validated throughout the manuscript. q value cutoff used throughout the analysis = 0.01.
(B) Gene set enrichment analysis of downregulated genes at 24 hr and 120 hr following BET inhibition, according to MSigDB.
(C and D) Time course expression of stem cell genes in hESCs (C) and mESCs (D), cultured in the presence of FGF (C) or LIF (D), upon compound treatment relative to vehicle-treated cells (dashed line), as detected by qRT-PCR.
(E) Effect of BET inhibitor treatment (3 days) on OCT4 protein levels as detected by immunoblotting. Tubulin is used as a loading control.
(F) Effect of compound treatment on hESC colony morphology (DAPI) and OCT4 protein expression as detected by immunostaining. The scale bar represents 100 μm.
(G and H) Relative mRNA expression of the indicated stem cell and housekeeping genes (HK) in hESCs (G) and mESCs (H) after BRD4 genetic depletion, as detected by qRT-PCR. Dashed lines represent nontargeting control (NTC)-transduced cells.
Error bars represent SD. See also Tables S1 and S2 and Figure S3.

