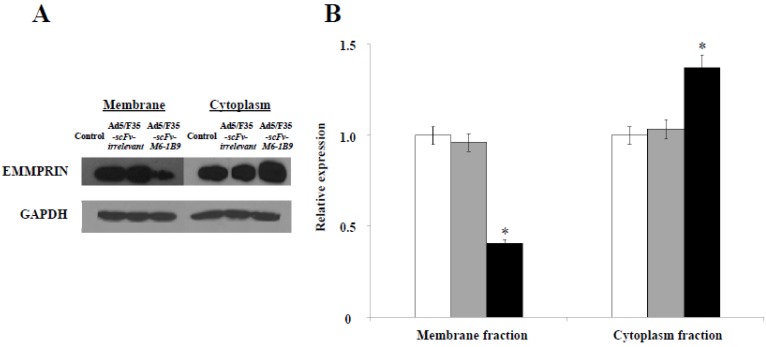
Figure 1.
Down-regulation of EMMPRIN cell surface expression via scFv-M6-1B9 intrabody and its accumulation inside Caco-2 cells. (A) Western blotting analysis of EMMPRIN protein expression and (B) densitometry analysis of EMMPRIN expression. The white, gray, and black bars represent the protein fractions from untransduced, Ad5/F35-scFv-irrelevant, and Ad5/F35-scFv-M6-1B9 transduced Caco-2 cells, respectively. Y-axis is the fold change of the EMMPRIN expression which was normalized with GAPDH. * p<0.05, as determined by one-way ANOVA.

