Figure 2.
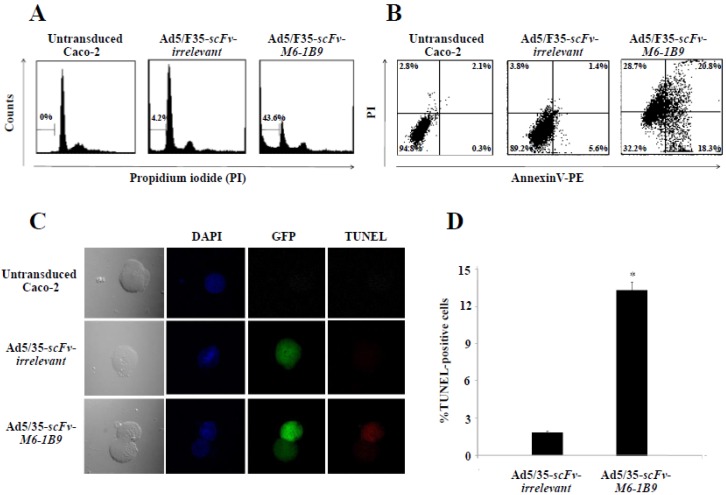
EMMPRIN down-regulation induced apoptosis in Caco-2 cells. Caco-2 cells were transduced with Ad5/F35-scFv-irrelevant or Ad5/F35-scFv-M6-1B9. Transduced GFP positive cells were used for the apoptosis studies. (A) FACS analysis with PI staining for the detection of apoptotic cells. The histogram presents the percentage of apoptotic cells in sub-G1 peak, which was calculated as the percentage of all the transduced cells. (B) Detection of phosphatidylserine externalization by Annexin V assay. The dual parametric dot plot shows the viable cell population in the bottom left quadrant (Annexin V- PI-), the early apoptotic cells in the bottom right quadrant (Annexin V+ PI-), the late apoptotic cells in the top right quadrant (Annexin V+ PI+), and the necrotic cells in the top left quadrant (Annexin V- PI+). Identification of DNA fragmentation by TUNEL assay, using (C) CLSM and (D) FACS analysis. Representative fluorescent images of TUNEL showed DAPI (blue) stained nuclei, transduced cells (green), and TUNEL-positive cells (red). *p<0.05, as determined by one-way ANOVA.

