Fig. 2.

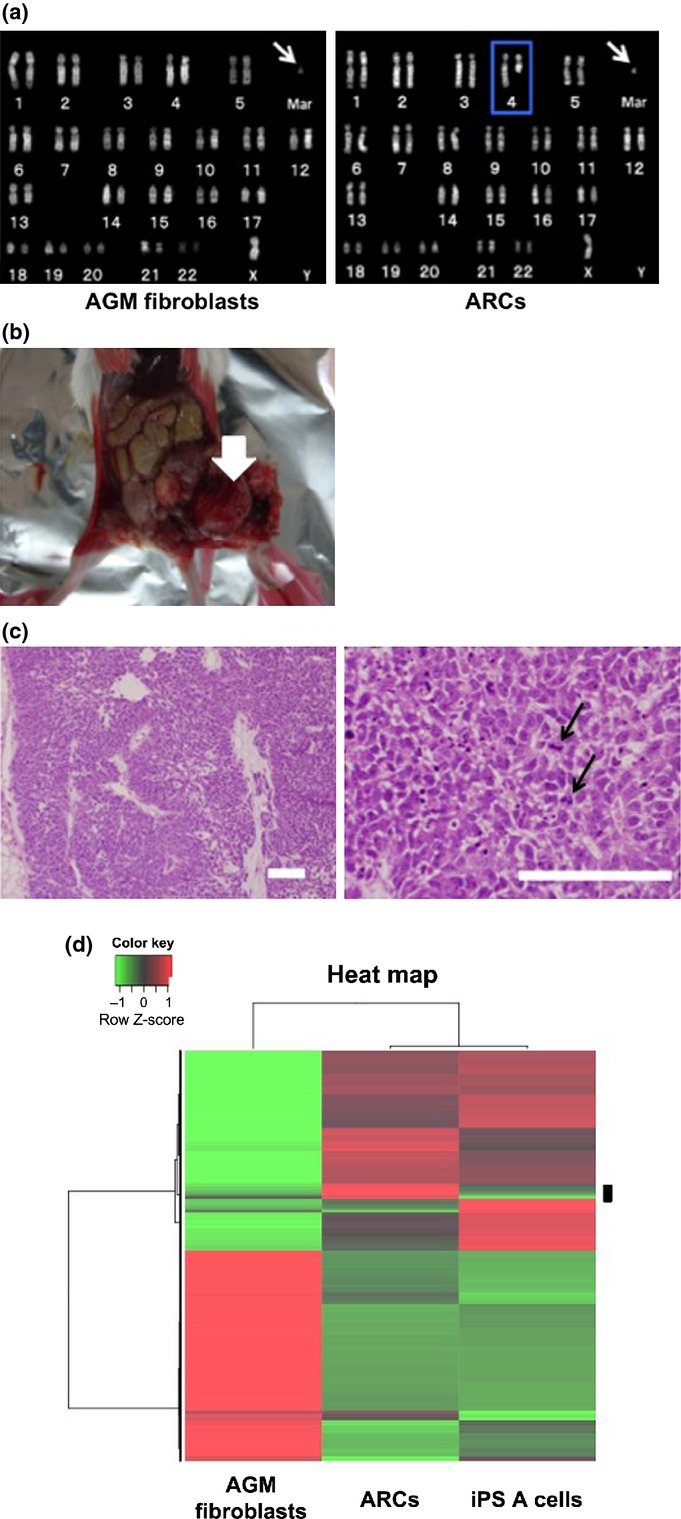
Chromosome abnormality and tumor-forming ability in abnormally reprogrammed cells (ARCs). (a) Karyotype analyses of aorta-gonado-mesonephros (AGM) fibroblasts (left panel) and ARCs (right panel). Arrows indicate marker chromosome. Blue outline indicates the deletion of 4q. Mar, marker chromosome. (b) Representative photograph of dysgerminoma-like tumor (arrow) formed by transplantation of ARCs into SCID mice. (c) Hematoxylin-eosin staining of dysgerminoma-like tumor tissues. Arrows in right panel indicate mitotic figures in tumor cells. Bar = 100 μm. (d) Microarray analysis. Gene expressions in AGM fibroblasts, ARCs, and normal induced pluripotent stem (iPS) A cells were analyzed by unsupervised hierarchical clustering. A heat map using probes showing differential expression levels in each cell line is shown. Red indicates upregulation; green indicates downregulation. The black bar on the right side of the heat map shows candidate differentially expressed probes in ARCs.
