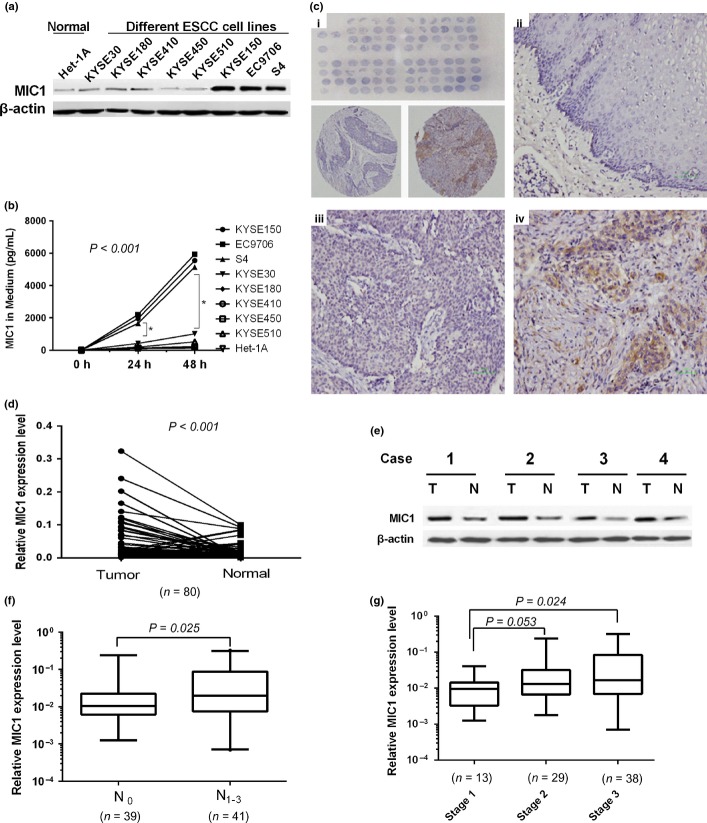
Fig. 3.
Expression macrophage inhibitory factor 1 (MIC1) in cell lines and tissue samples. (a) Western blotting analysis of MIC1 expression in eight established esophageal squamous cell carcinoma (ESCC) cell lines and one human normal esophageal cell line. (b) The level of MIC1 in cell culture media detected by enzyme linked immunosorbent assay (ELISA). (c) MIC1 expression detected by IHC staining in tissue microarrays (TMA) of ESCC and normal tissues. Overview of the TMA (up) and two representative cylinders (down; i), Negative expression of MIC1 was shown in Normal esophageal tissue (ii). Weak positive (iii) and strong (iv) expression of MIC1 in ESCC tissues. (d) MIC expression in paired ESCC cancerous (T) and surrounding normal tissues (N), normalized by GAPDH (glyceraldehyde 3-phosphate dehydrogenase). (e) Western blotting analysis of MIC1 protein expression. (f) Relative expression of MIC1 in tissues grouped by total tumor node metastasis stage, normalized by GAPDH. (g) Relative expression of MIC1 in ESCC tissues classified according to N stage.

