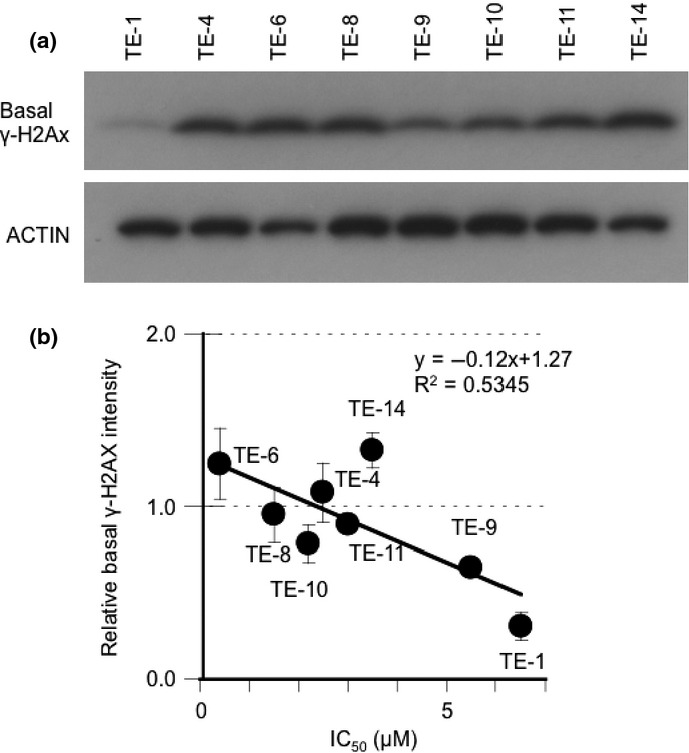
Fig. 4.

A strong correlation between base-level γ-H2AX and sensitivity to AZD2281 of TE cells. (a) Eight non-treated TE-series cell lines were subjected to Western blot analysis with antibodies against γ-H2AX and actin. (b) The correlation between basal γ-H2AX expression levels and IC50 of AZD2281. The average intensity of γ-H2AX was standardized with actin. The data represent the averages and standard deviations of three independent experiments.
