Figure 1.

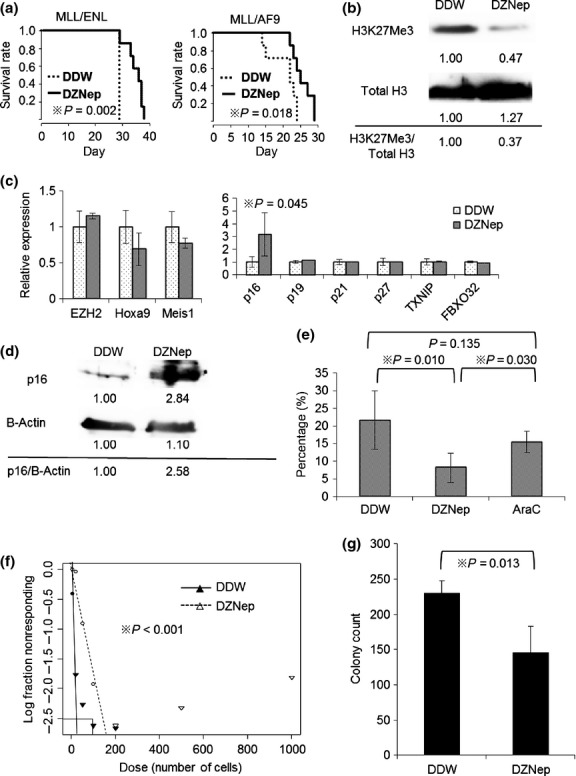
Administration of EZH2 inhibitor is therapeutically effective in MLL fusion leukemic mouse models. (a) Mice were injected intravenously with 1 × 10⁴ of leukemia cells. From 7 days after injection, mice were treated intraperitoneally with DZNep, 2 mg/kg 3 days per week, until death. Survival of the mice in both groups (DDW as vehicle control and DZNep) is represented by Kaplan–Meier plot. P-values were calculated by log-rank test. N = 7 for each group. (b) Total BM cells were collected and lysed at 21 days after transplantation. Immunoblot analysis was performed for H3K27Me3. The levels of total H3 served as the loading control. Values indicate relative density scale. (c) GFP positive BM cells were sorted and analyzed by qRT-PCR at 21 days after transplantation. Relative expression of EZH2 and its target genes are shown. P-values were calculated by unpaired T test. N = 6 for DDW group and N = 5 for DZNep group. (d) Immunoblot analysis was performed for p16. The levels of β-actin served as the loading control. (e) The BM cells of MLL/AF9 leukemic mice treated with DDW, DZNep or AraC (100 mg/kg intraperitoneally from day 14–18) were collected and analyzed by flow cytometry at 21 days after transplantation. The percentages of L-GMP in GFP positive cells are shown (N = 6, 4 and 5). P-values were calculated by unpaired T test. (f) GFP positive BM cells were sorted and limiting dilution assay was performed. Poisson distribution of LIC frequency is shown. P-value was calculated by chi-square test. (g) 1 × 10⁴ of sorted GFP positive BM cells were placed in 1 ml of methocult M3434 and cultured for 5 days. Colony counts for each group are shown. P-value was calculated by unpaired T test. N = 4 for each.
