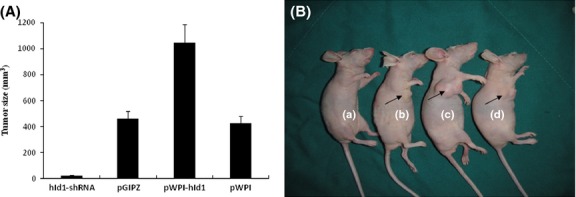
Figure 5.

Xenografted tumor formations in nude mice. Nude mice were injected (s.c.) with (a) N-nitrosopyrrolidine (NPYR) transformed hId1-shRNA H8 cells, (b) NPYR transformed pGIPZ H8 cells (as control), (c) NPYR transformed pWPI-hId1 H8 cells, (d) NPYR transformed pWPI H8 cells (as control), and were photographed 8 weeks after injection. There were 10 mice in each group. Tumor size was presented as means ± SD. One representative mouse from each group is shown. Injection sites are indicated by arrowheads.
