
Figure 2.
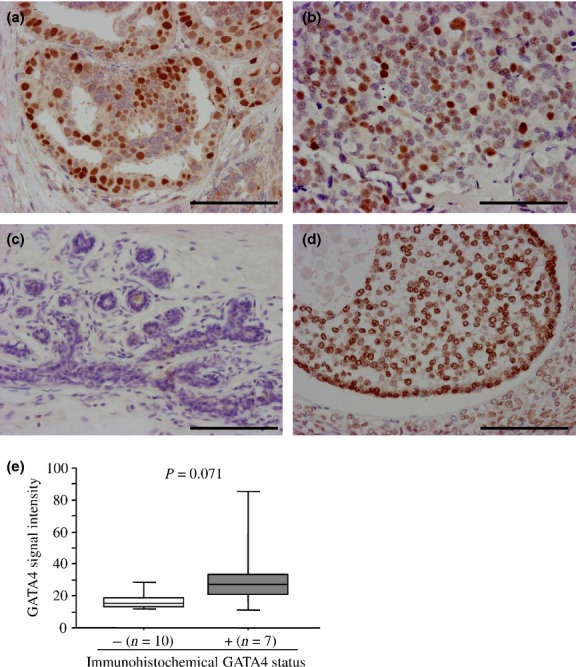
Immunohistochemistry for GATA4 in breast carcinoma. (a, b) GATA4 immunoreactivity was detected in the nucleus of carcinoma cells in ductal carcinoma in situ (DCIS) (a) and invasive ductal carcinoma (IDC) (b) tissues. (c) GATA4 immunoreactivity was not detected in the non-neoplastic mammary epithelium or stroma. (d) In the positive control section, GATA4 immunoreactivity was detected in granulosa cells of the antral follicle in the ovary. Bar, 100 μm, respectively. (e) Association between immunohistochemical GATA4 status and the signal intensity of the GATA4 gene obtained from microarray (n = 17). Data are represented as a box and whisker plot (open box, GATA4-negative group; and gray box, GATA4-positive group). The median value is represented by a horizontal line in each box and the 75th (upper margin) and 25th (lower margin) percentiles of the values are demonstrated. The upper and lower bars indicated the 90th and 10th percentiles, respectively. Statistical analysis was performed using the Mann–Whitney U-test.