
Fig. 3.
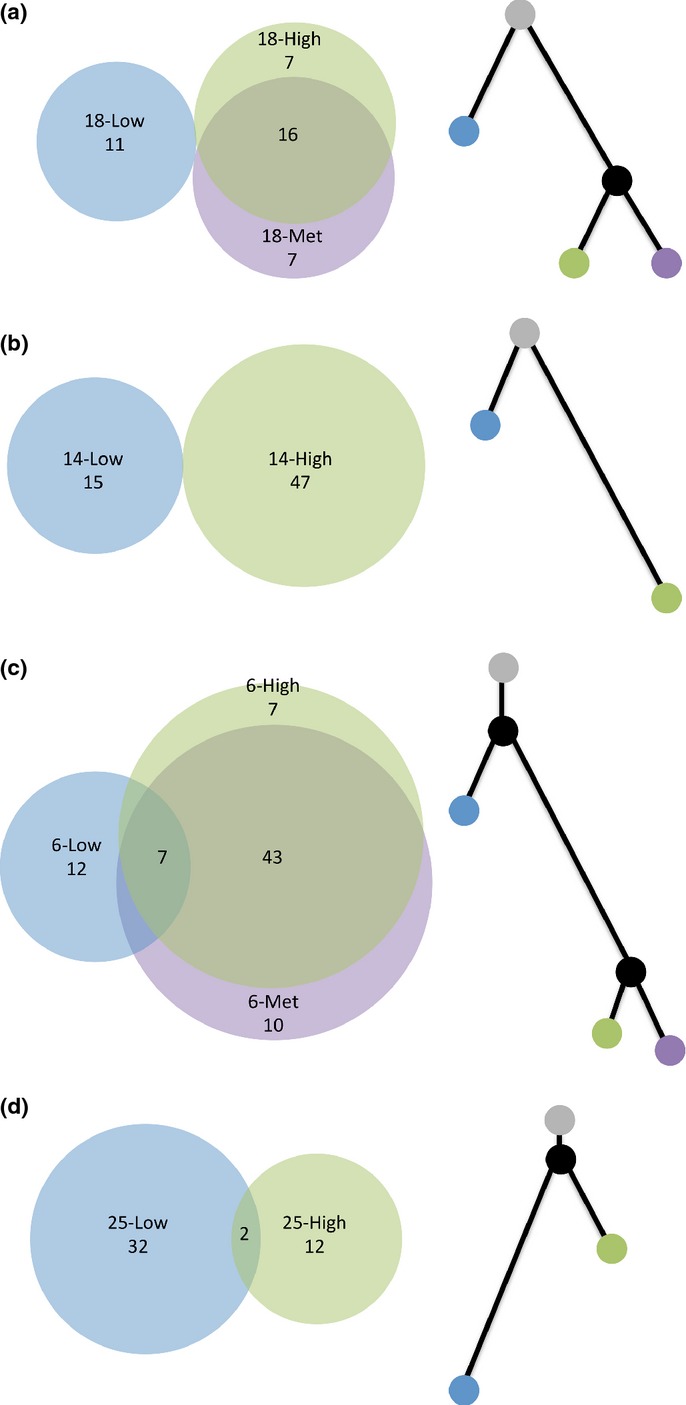
The molecular relationship of coincident foci. Venn diagrams (left) depicting the pattern of shared and private high-confidence somatic mutations and phylogenetic trees (right) depicting the relationship of coincident foci for PrCa 18 (a), PrCa 14 (b), PrCa 6 (c) and PrCa 25 (d). The number of high-confidence somatic mutations is labeled within each Venn diagram. In (c), there are no mutations that are shared between the low-grade focus and the metastatic focus and also not shared with the high-grade focus. Within each phylogenetic tree, branch length is proportional to the number of mutations. Gray, uninvolved prostate; blue, low-grade focus; green, high-grade focus; purple, metastatic focus; black, theoretical common progenitor.