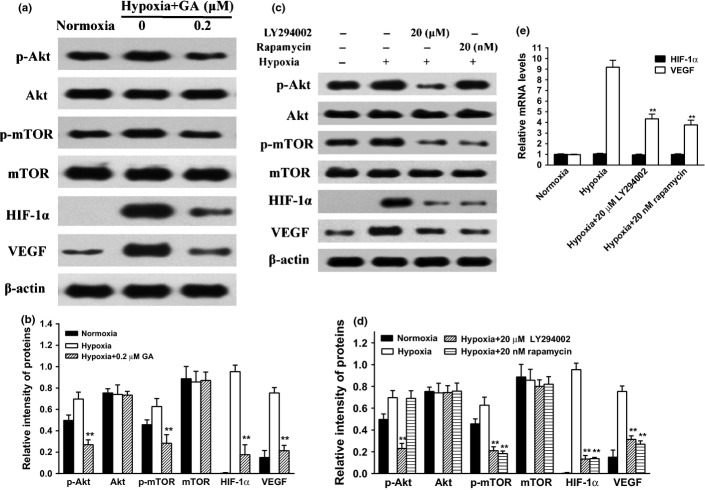
Fig. 4.
Role of PI3K/Akt/mTOR in the accumulation of in U266 cells. (a) U266 cells were exposed to normoxia or hypoxia in the presence or absence of different concentrations of GA (0 and 0.2 μM) for 4 h. Then, the protein expression involved PI3K/Akt/mTOR pathway as analyzed by western blots. β-actin was used as a loading control. (b) For quantity of (a), images were analyzed using Image J. Bars were the mean ± SD (n = 3). The comparisons were made relative to hypoxia alone group, and the different levels of significance was indicated as **P < 0.01. (c) U266 cells were exposed to normoxia or hypoxia in the presence or absence of LY294002 (20 μM) or rapamycin (20 nM) for 4 h. Then, the protein expression involved PI3K/Akt/mTOR pathway was analyzed by western blots. β-actin was used as a loading control. (d) For quantity of (c), images were analyzed using Image J. Bars are the mean ± SD (n = 3). The comparisons were made relative to hypoxia alone group, and the different levels of significance was indicated as **P < 0.01. (e) U266 cells were exposed to normoxia or hypoxia in the presence or absence of LY294002 (20 μM) or rapamycin (20 nM) for 4 h. vascular endothelial growth factor (VEGF) and hypoxia-inducible factor-1α (HIF-1α) mRNA were detected by real-time polymerase chain reaction (PCR) and analyzed by the ΔΔCt method. Bars are shown as mean ± SD (n = 3). The comparisons were made relative to hypoxia alone group, and the different levels of significance was indicated as **P < 0.01.

