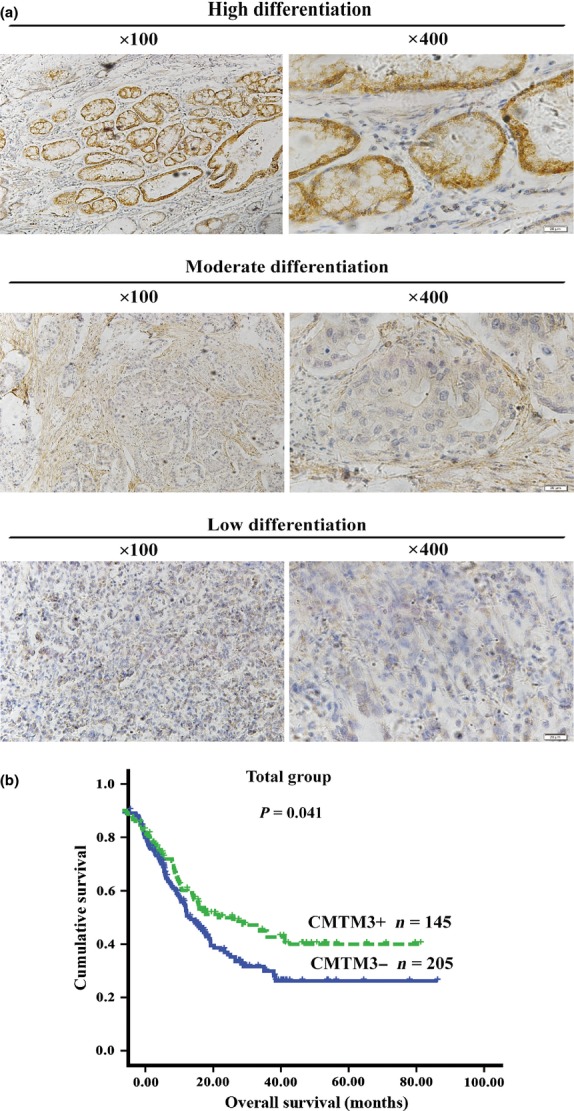
Figure 4.

(a) Immunohistochemical staining showing the relationship between CMTM3 expression and gastric cancer by representative images (magnification, ×100 [left] and ×400 [right]). (b) Kaplan–Meier survival curve showing the association between CMTM3 expression and patients' survival. CMTM3+, CMTM3 positive; CMTM3−, CMTM3 negative; n, number of patients.
