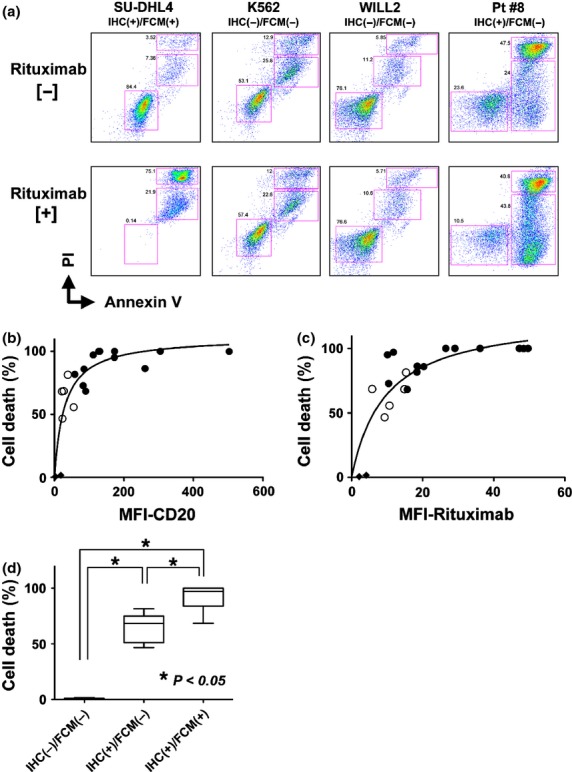
Figure 4.

In vitro CDC activity induced by rituximab. (a) Annexin V-PI staining was performed with/without rituximab and human serum treatment in vitro. In this assay, living, pro-apoptotic, or dead cell populations were separated in a 2-dimensional graph, and the percentage of each group was calculated. The SU-DHL4 cell line was a positive control. The K562 and WILL2 cell lines were negative controls. Representative primary lymphoma cells showing the IHC(+)/FCM(−) phenotype were obtained from patient #8 and utilized in this assay. (b) The relationship between the percent of cell death with rituximab-induced CDC activity and the CD20-B1-MFI value (performed in Fig.3) was plotted in this graph. Primary lymphoma samples showing CD20 IHC(+)/FCM(+) (black circles) and IHC(+)/FCM(−) (white circles) were used. Each circle indicates one lymphoma sample from a corresponding patient. RRBL1 and WILL2 cells are indicated in black diamonds. (c) The same analysis using the rituximab-MFI values is shown. Nonlinear regression curve fitting is indicated as curved lines. (d) Cell death percentages were statistically compared using Turkey's multiple comparison test. Asterisks indicate significant differences.
