Figure 2.

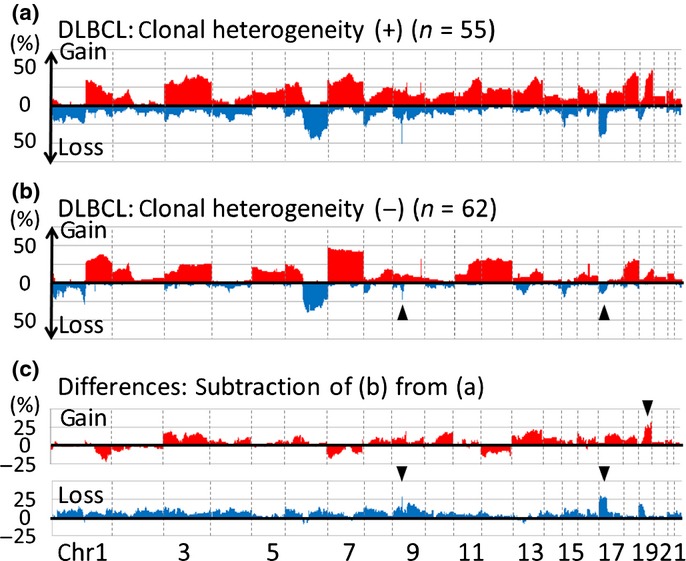
Chromosomal regions and frequencies of copy number alterations (CNA) for DLBCL with and without clonal heterogeneity. (a) CNA for 55 diffuse large B-cell lymphoma (DLBCL) cases with clonal heterogeneity. The x-axis represents chromosomal regions and the y-axis represents frequencies of gain (above 0) or loss (below 0). (b) CNA for 62 DLBCL cases without clonal heterogeneity. The profile of cases without clonal heterogeneity resembles those of cases with clonal heterogeneity (a) while loss of 9p and 17p are less common in cases without heterogeneity than in those with (arrowheads). (c) Differences in CNA between DLBCL with and without clonal heterogeneity. (Top) Subtraction of frequencies of gain in cases without clonal heterogeneity (b, red area) from those with (a, red area). The y-axis represents differences in frequency (>0: higher frequencies in cases with clonal heterogeneity; <0: higher frequencies in those without clonal heterogeneity). The characteristic gain in DLBCL cases with clonal heterogeneity is 19p (arrowhead) with more than 25% differences between cases with and without clonal heterogeneity. (Bottom) Subtraction of frequencies of loss in cases without clonal heterogeneity (b, blue area) from those with clonal heterogeneity (a, blue area). The y-axis represents differences (>0: higher frequencies in cases with clonal heterogeneity; <0: higher frequencies in those without clonal heterogeneity). The characteristic loss in DLBCL cases with clonal heterogeneity are 9p and 17p (arrow heads). All gain and loss with differences >25% are summarized in Table 3.
