Figure 2.

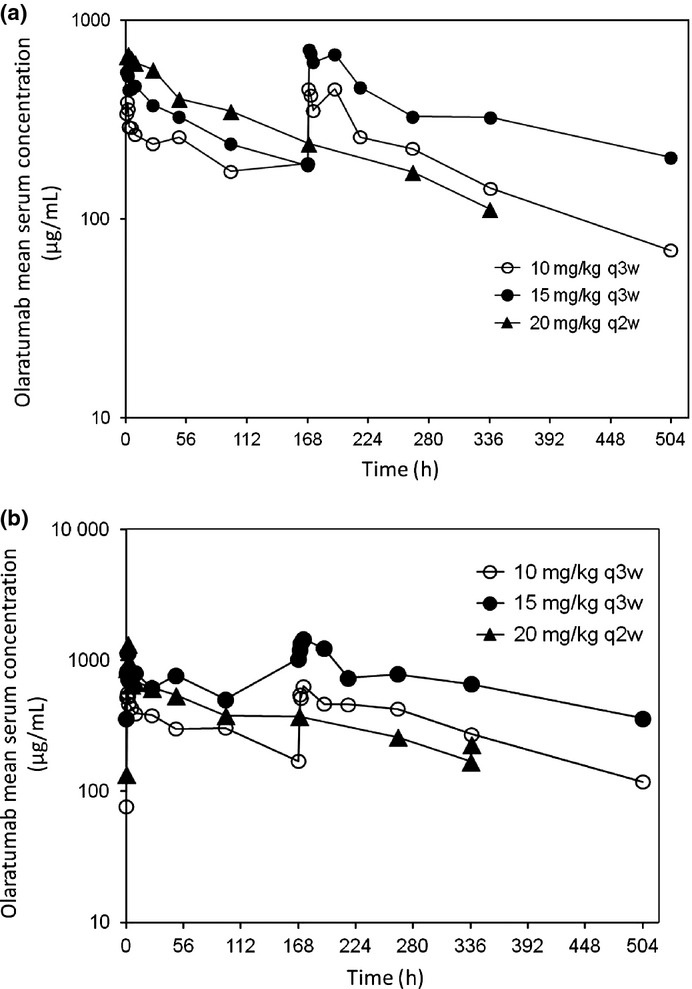
Arithmetic mean olaratumab serum concentration versus time profiles following the first dose (a) and multiple (b) doses of olaratumab. Semi-log scales are shown in each plot. h, hour; q2w, every 2 weeks; q3w, every 3 weeks.

Arithmetic mean olaratumab serum concentration versus time profiles following the first dose (a) and multiple (b) doses of olaratumab. Semi-log scales are shown in each plot. h, hour; q2w, every 2 weeks; q3w, every 3 weeks.