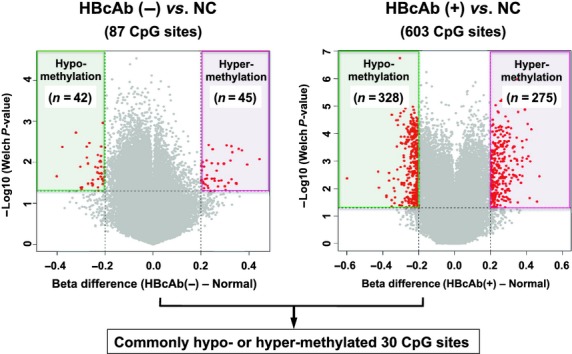
Figure 1.

Volcano plots for differential DNA methylation status. The x-axis shows the mean DNA methylation (Beta-value) difference, whereas the y-axis shows the –log10 of the P-value for each CpG site, representing the strength of association. Eighty-seven differentially methylated CpG sites in hepatitis B core antibody (HbcAb) (−) liver tissues and 603 CpG sites in HBcAb (+) liver tissues in comparison with normal control (NC) liver tissues using (Beta-value difference >0.2, P < 0.05) are plotted in red.
