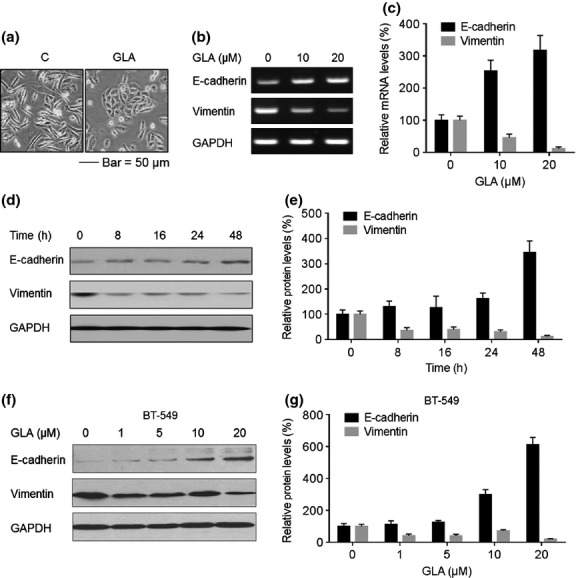
Figure 3.

Effects of glabridin (GLA) on the epithelial–mesenchymal transition (EMT) markers in MDA-MB-231 and BT-549 cells. (a) Morphological images of MDA-MB-231 cells exposed to 0 or 10 μM GLA for 4 days. (b) MDA-MB-231 cells were exposed to 0, 10 or 20 μM GLA for 2 days. RT-PCR analyses and (c) relative mRNA levels of E-cadherin and vimentin were determined (mean ± SD, n = 3). MDA-MB-231 cells were exposed to 10 μM GLA for 0, 8, 16, 24 or 48 h. Western blot analyses (d) and relative protein levels (e) of E-cadherin and vimentin (mean ± SD, n = 3). BT-549 cells were exposed to 0, 1, 5, 10 or 20 μM GLA for 48 h. (f) Western blot analyses and (g) relative protein levels of E-cadherin and vimentin (mean ± SD, n = 3).
