
Figure 2.
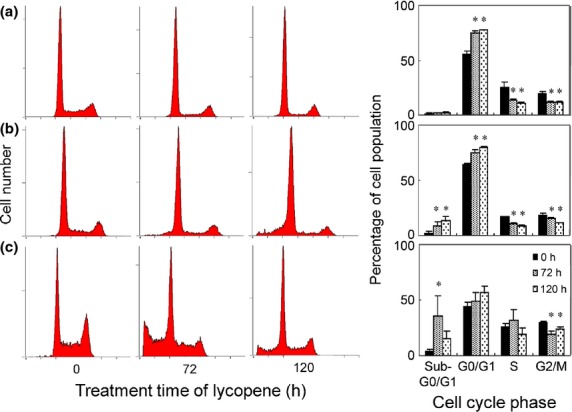
Time-course analysis of the effect lycopene on cell-cycle progression and apoptosis determined by flow cytometry. Representative cell-cycle distributions after exposure to 50 μM lycopene for 0, 72 and 120 h. MCF-7 (a), SK-BR-3 (b) and MBA-MB-468 (c). Percentages of the total cell population in the different phases of cell cycle are also shown as column bars in the right panels of each cell line. Mean ± SD of three independent experiments. *Significant difference versus vehicle control. P < 0.05.