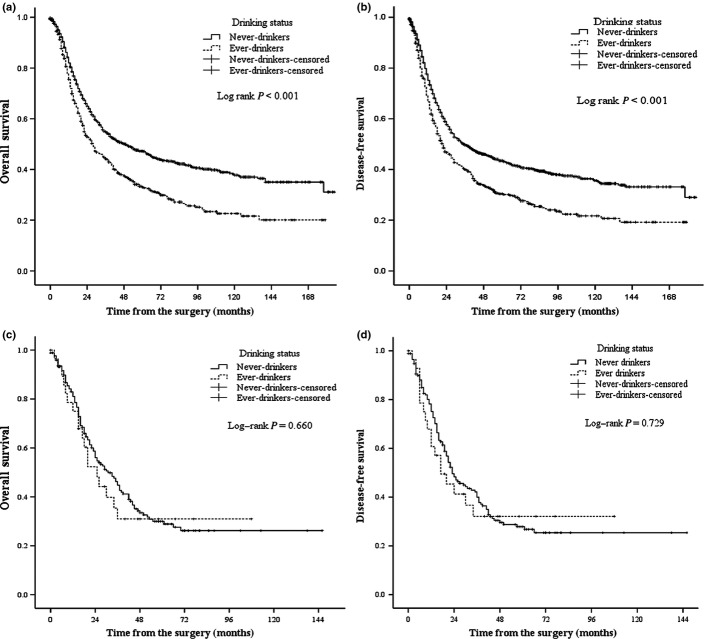
Fig. 2.
Kaplan–Meier survival curves are shown for overall survival (a) and disease-free survival (b) in patients with esophageal squamous cell carcinoma according to alcohol drinking status. Kaplan–Meier survival curves are shown for overall survival (c) and disease-free survival (d) in patients with esophageal adenocarcinoma according to alcohol drinking status. P-values were calculated using the unadjusted log–rank test.

