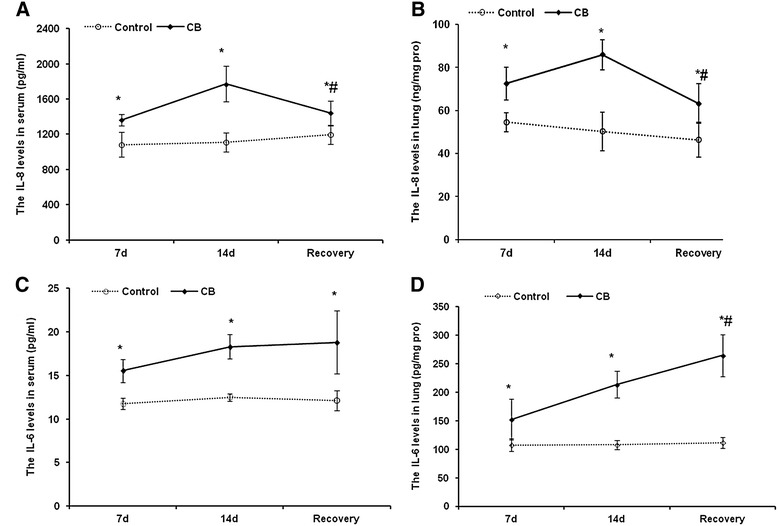
Figure 2.

The levels of IL-8 and IL-6 in serum and the lung tissue of mice after CB exposure for different time and recovery for 14 d after 14 d CB exposure. A: The levels of IL-8 in serum of mice. B: The levels of IL-8 in the lung tissue of mice. C: The levels of IL-6 in serum of mice. D: The levels of IL-6 in the lung tissue of mice. Data were expressed as mean ± SD. Multi-group comparisons of the means were carried out by a one-way analysis of variance test followed by SNK’s multiple comparison tests. * P < 0.05 compared to the control group.
