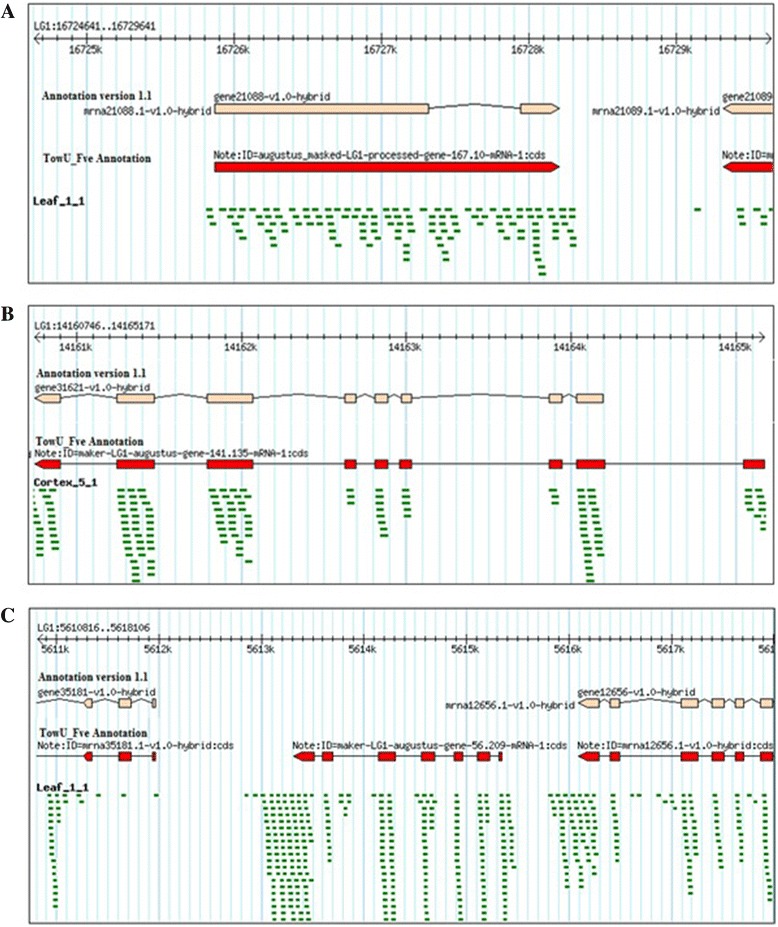
Figure 3.

Comparisons of version 1.1 annotation with the TowU_Fve annotation. (A) The version1.1 (peach color) annotation shows two exons connected by an intron. However, leaf RNASeq reads align to the intronic region. The TowU_Fve annotation (red) merges two existing exons by including the intronic region. (B) The version1.1 (peach color) annotation is missing the last exon revealed by cortex tissue RNASeq reads alignments. The TowU_Fve annotation (red) shows the newly predicted gene structure with the addition of the distal exon. (C) The first generation annotation (peach color) shows an absence of a gene between 5613k and 5616k, while the aligned reads from leaf tissue revealed the existence of an expressed gene at that site. The TowU_Fve annotation (red) shows a newly predicted gene (an alpha/beta-hydrolase domain-containing protein) between gene35181 and gene12565.
