
Figure 3.
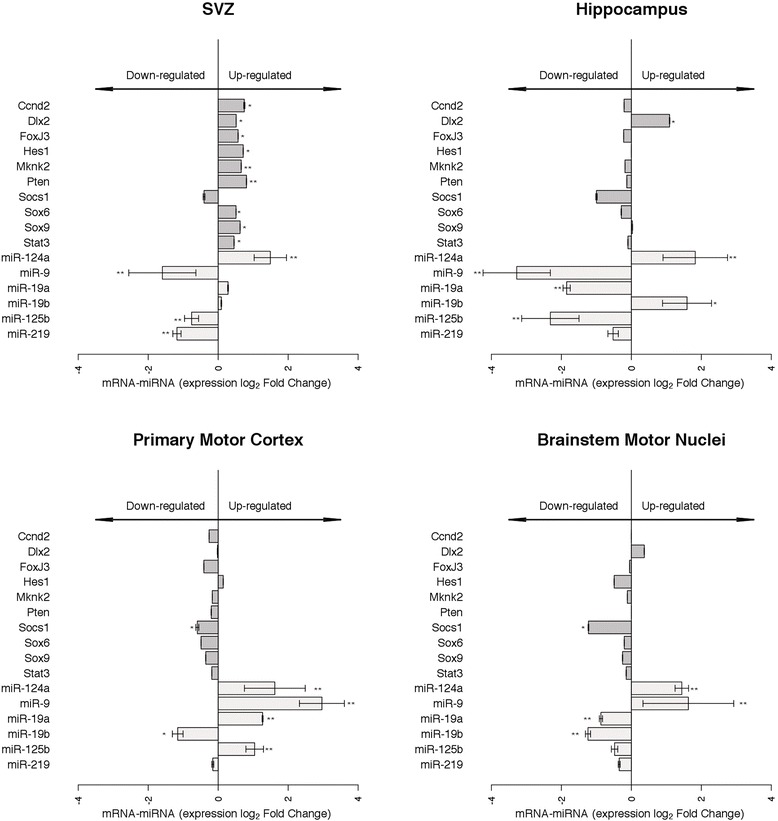
Altered expression of predicted miRNA targets in distinct regions of G93A-SOD1 mouse brain. Data are presented as means ± SD of log2 of fold changes of 2-ΔCT expression in G93A-SOD1 relative to Wt-SOD1 (grey bars) at late stage disease (week 18). Significant changes in mRNA (*p < 0.05, **p < 0.01, grey bars) and miRNA (*p < 0.05, **p < 0.01, light grey bars) expression relative to control are indicated. Limma moderated t-test.