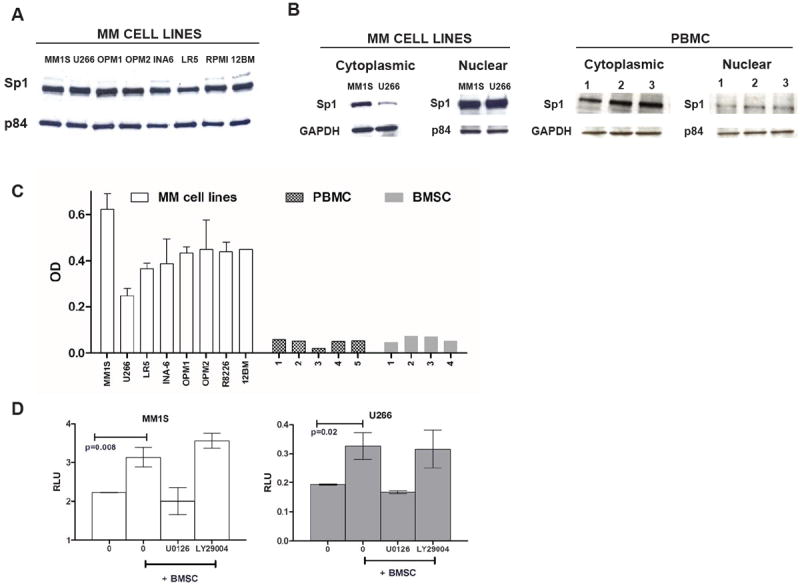
Figure 1. High Sp1 protein expression and activity in MM cells.

(A) Nuclear extracts from 8 MM cell lines were subjected to WB analysis using anti-Sp1 and p84 Abs. (B) Nuclear and cytoplasmic extracts from MM1S, U266 and PBMCs from 3 healthy donors were subjected to WB analysis using anti-Sp1 and GAPDH or p84 Abs. (C) 15 μg of nuclear proteins were analyzed for Sp1 activity using the Sp1 TF ELISA kit which measures Sp1 DNA binding activity. Absorbance was obtained with a spectrophotometer at 450 nm and presented as OD. (D) MM1S and U266 cells were transiently transfected with either negative control (NC)-luc or Sp1-promoter driven -Luc. After 48 h from transfection, MM cells were treated with 10 μM of U0126 or LY29004 or control for 30 minutes, washed and then cultured in absence (-) or presence (+) of BMSC for additional 6 h. The firefly luciferase activity was measured in cell lysate and normalized according to Renilla luciferase activity and expressed as relative luciferase units (RLU) to reflect the Sp1 promoter activity in the absence or presence of BMSC. The graph shows one representative experiment of two performed in triplicate. Results are shown as mean ± standard deviation.
