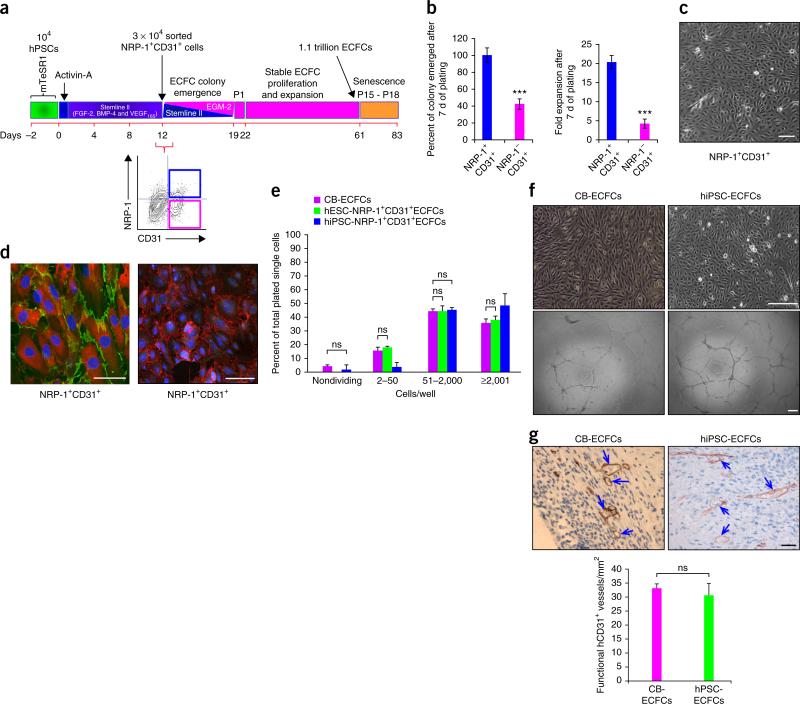
Figure 1.
Simple one-step, 2D, serum-free, endothelial lineage differentiation protocol does not require embryoid body formation or TGF-β inhibition and yields ECFCs similar to those found in cord blood. (a) Schematic representation showing an estimation of generation of over a trillion cells in 61 d, starting from 104 hESCs or hiPSCs. Generation of 3 × 10⁴ NRP-1+CD31+ cells in 12 d is shown on left. A representative flow cytometry contour plot (bottom right) indicates the percent expression of NRP-1 and CD31 in day 12 differentiated cells. Day 12 NRP-1+CD31+ cells give rise to stable ECFC colonies that undergo extensive expansion. (b) Day 12 differentiated cells were sorted for NRP-1+CD31+ and NRP-1−CD31+ cell fractions and cultured in transitioning media for endothelial growth. NRP-1+CD31+ cells gave rise to 60% more endothelial colonies (left panel) and 15-fold more total endothelial cells (right panel) compared to NRP-1−CD31+ cells in 7 d of culture. n = 5; mean ± s.d. Student's t-test: ***P < 0.001. (c) A representative photomicrograph of ECFC colony obtained from NRP-1+CD31+ cell fraction exhibiting characteristic cobblestone morphology containing homogenous population of endothelial cells within each colony. Experiments were performed eight times in duplicate. Scale bars, 50 μm. (d) Representative immunofluorescence micrographs of ECFCs exhibiting cell surface expression for typical endothelial markers CD31, CD144 and NRP-1 and the nonendothelial marker α-SMA. Left, NRP-1 expression (red); CD31 (green). Right, α-SMA (green); CD144 (red). Nucleus (DAPI, blue). All experiments were performed three times in duplicate. Scale bars, 50 μm. (e) Clonal proliferative analysis of hESC-ECFCs and hiPSC-ECFCs in comparison with CB-ECFC control. The distribution pattern of colonies formed by clones of hESC-ECFCs and hiPSC-ECFCs formed HPPs (≥2,001 cells/well) and low PPs (51–2,000 cells/well) similar to levels produced by CB-ECFCs. n = 3; mean ± s.d. Student's t-test: P value not significant (ns). (f) Representative phase-contrast photomicrographs of hiPSC-ECFCs’ characteristic cobblestone morphology and formation of complete capillary networks on Matrigel similar to that exhibited by CB-ECFCs. All experiments were performed five times in duplicate. Scale bars, 100 μm. (g) ECFCs form durable and functional in vivo human vessels in immunodeficient mice. ECFCs (both from cord blood and hiPSCs) containing cellularized collagen gels were implanted in immunodeficient (NOD/SCID) mice in a subcutaneous pouch, recovered 14 d later, and fixed and stained. Arrows in the representative photomicrograph depict anti-human CD31+-stained functional human blood vessels that are perfused with circulating host mouse red blood cells. Scale bar, 50 μm. A bar graph represents quantification of functional hCD31+ vessels counted per mm2 in each group. n = 3; mean ± s.d. Student's t-test: ns.

