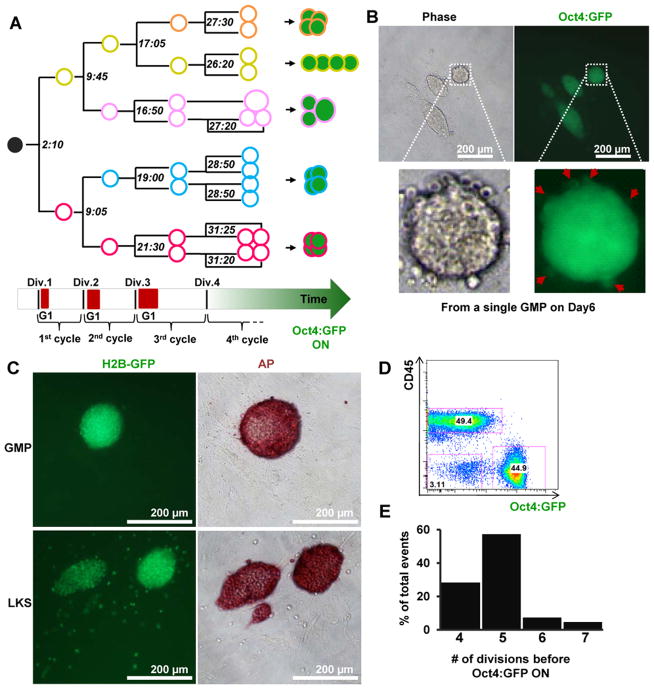
Figure 2. Non-stochastic reprogramming from a subset of GMPs.
(A) A representative lineage map from a single GMP to Oct4:GFP+ progeny. The color of the circles corresponds to the color of arrows in Movie S1 and Figure S1A. Lines denote lineage relationship. Filled green circles denote Oct4:GFP fluorescence as detectible by time-lapse imaging. The numbers (hours:minutes) at each branching point indicate the time when mitosis occurred and were used to derive cell cycle lengths. Red blocks on the horizontal block arrow indicate reporter signals of a G1 phase reporter (see Figure S2 and Movie S2). (B) GMPs were transduced with Dox-inducible Yamanaka factors and single cell sorted into 96-well plates in reprogramming conditions (scheme in Figure S5A). Representative images of the reprogramming product of a single GMP are shown. Note the presence of multiple sister colonies and many of the round-shaped cells in the vicinity of Oct4:GFP+ colonies are also GFP+ (zoom in, red arrows). (C) GMP and LKS cells from H2B-GFP mice were reprogrammed as single cells. Representative images of the reprogramming culture from a single GMP (top row) or LKS cell (bottom row) after 6 days of Dox induction are shown. Note the presence of H2B-GFP+, alkaline phosphatase (AP) negative cells in LKS-initiated culture, but not in the GMP-initiated culture. Slight increase in colony sizes was noted after fixation/staining. (D) GMP-initiated reprogramming culture were trypsinized after 6 days of Dox-induction and stained with a CD45 antibody. A representative FACS plot shows that CD45+ hematopoietic cells and Oct4:GFP+ cells make up ~97% of the culture. (E) The number of mitotic divisions before Oct4:GFP became detectible by imaging (n=38). See also Figures S1, S2, S5A, Table S1 and Movies S1, S2.

