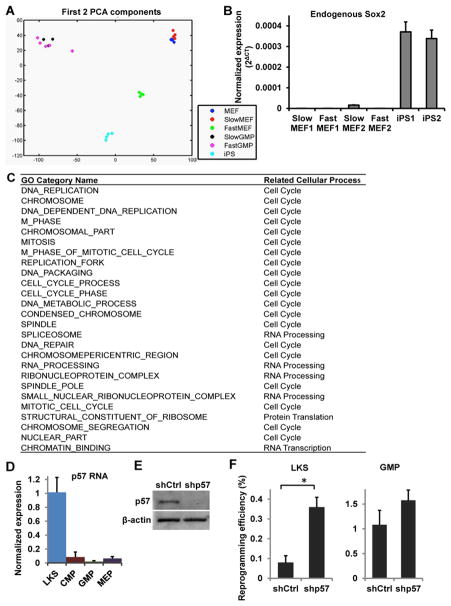
Figure 7. Molecular characterization of the cellular states.
(A) Principle Component Analysis (PCA) was performed on RNA sequencing data. Isolation of fast and slow cells was performed as described above. Dox-independent reprogrammed cells (iPS) and bulk MEFs (MEF) were included as controls. Three to five replicates were used for each cell type. (B) The endogenous Sox2 level was measured by qRT-PCR using primers specific for its 3′UTR region. Two biological replicates for each cell type are shown. (C) Gene Set Enrichment Analysis (GSEA) was performed comparing the fast cells (FastGMP and FastMEF) versus the slow cells (MEF and SlowMEF). The top 25 Gene Ontology (GO) categories enriched in both fast cell populations are shown. (D) qRT-PCR analysis of p57 mRNA level in HSPCs. (E) Western blot analysis confirms p57 protein down-regulation by p57 targeting shRNAs. (F) Reprogramming efficiency of LKS and GMP cells following treatment with control (shCtrl) or p57 targeting shRNAs (shp57). Error bars indicate standard deviation. See also Figure S7.

