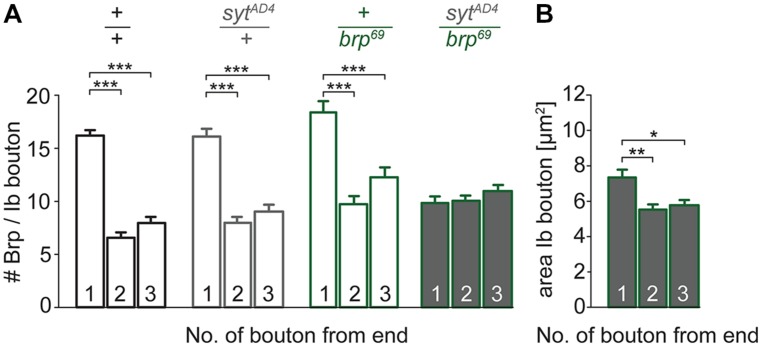
FIGURE 7.
Genetic interaction between brp and syt. (A) Summary bar graphs for the number of Brp puncta per terminal three type Ib boutons of wt (+/+, black), heterozygous sytAD4 (sytAD4/+, gray), heterozygous brp69 (+/brp69, green) and trans-heterozygous sytAD4/brp69 larvae (gray with green edge). (B) Summary bar graph for the area of the three terminal type Ib boutons in sytAD4/brp69 trans-heterozygotes.

