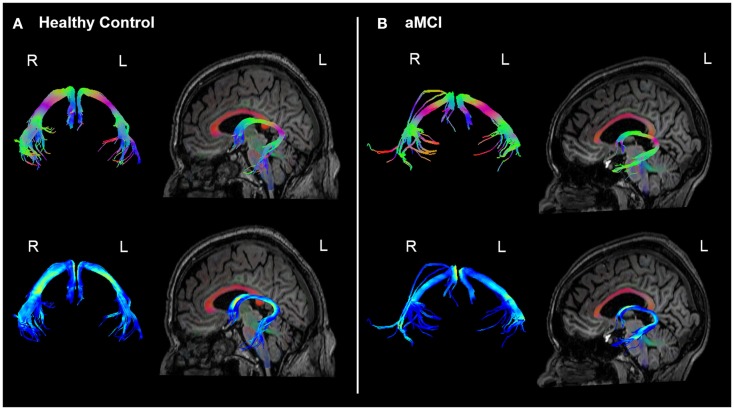
Figure 3.
Example fornix tracts in a (A) healthy control and (B) amnestic aMCI subject. The top panel in each case shows the tracts color-encoded with the first eigenvector (FE); the bottom panel shows the same tracts color-encoded with FA values. For each subject, the left and right fornix is shown in isolation on the left, and on the right the fornix can be seen overlaid on the subject’s T1-weighted structural image, with the FE shown in semi-transparent color (note the corpus callosum in red for example). The DWI data were co-registered to the structural images during the processing to correct for EPI-induced geometric distortions, however as illustrated by these figures this also facilitates the inspection of the white tracts in reference to the high-resolution anatomical image of the brain.

