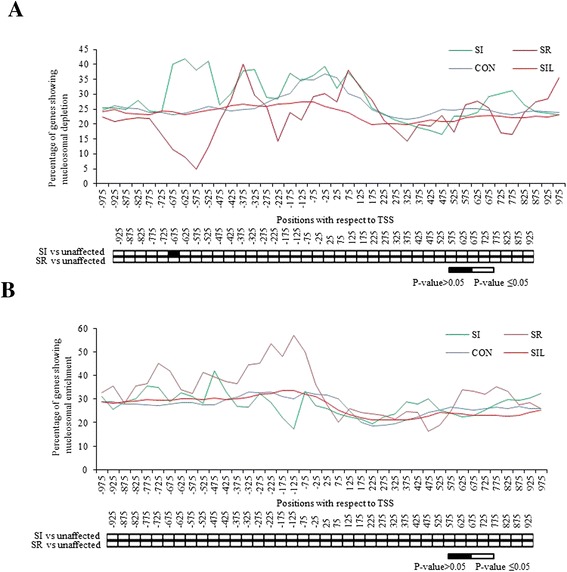
Figure 4.

Salicylic acid (SA) induced nucleosomal remodeling is more frequent in the SA responsive genes. The figure represents percentage of genes showing remodeled nucleosome out of total nucleosomes under any of the two conditions (A shows the nucleosomal depletion and B shows the nucleosomal enrichment respectively upon SA treatment) in −1000 bp to +1000 bp long regions in all the four groups. X-axis represents the positions with respect to Transcription start site (TSS) where −75 means −51 to −100. Y-axis represents percentage of genes having remodeled nucleosome at the particular position. Below the graph is the statistical significance data for each position when compared for different groups as mentioned beside the map (Unaffected group constitutes ‘CON’ and ‘SIL’ groups together) at P-value ≤0.05.
