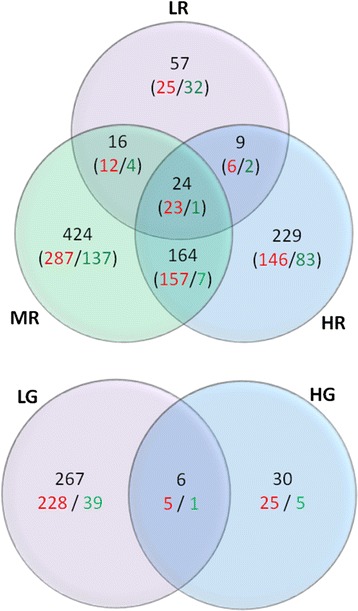
Figure 1.

Venn diagrams displaying the numbers of differentially expressed transcripts (FDR < 0.1) in each treatment group obtained from edgeR using the Trinity assembly as a template. Red and green numbers represent up- and down-regulated transcripts, respectively. Treatments are represented by the following codes: LR, MR and HR represent 0.01, 0.5 and 10 mg/L Roundup, and LG and HG represent 0.01 and 10 mg/L glyphosate.
