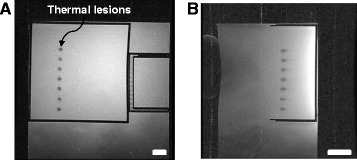
Figure 7.

Discrete thermal lesions created in the gel phantom. Using the linear stage of the positioning device imaged using T2-W FSE in a 1.5-T GE scanner. The intensity used was 1,500 W/cm2 (spatial average in situ) for 10 s. The spacing between the lesions was 10 mm. The bar corresponds to 5 mm. (A) Perpendicular to the transducer beam and (B) parallel to the transducer beam. The bar corresponds to 10 mm.
