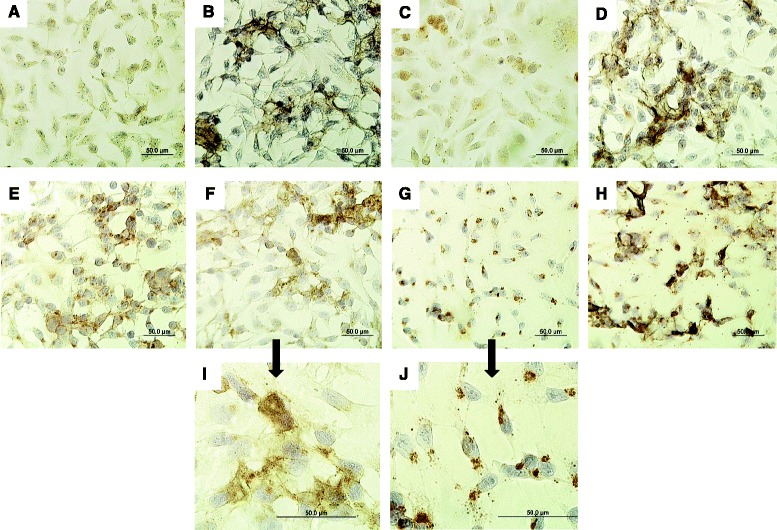
Figure 7.

Detection of sialic acid receptors in SAEC exposed to SWCNTs and IAV. SAEC were exposed to 50 μg/ml SWCNTs, 5.0 MOI IAV or pre-treated with 50 μg/ml SWCNTs for 24 h followed by exposure to 5.0 MOI IAV for 24 h. Cells were fixed and probed with (A-D) SNA lectin or (E-H) MAA lectin to detect receptors with α-2,6- to α-2,3-linked sialic acids, respectively. The top panels represent SAEC probed with SNA lectin for the following treatments; (A) control, (B) SG65 SWCNTs, (C) IAV, (D) SWCNTs + IAV. The middle panels represent SAEC probed with MAA lectin for the following treatments; (E) control, (F) SG65 SWCNTs, (G) IAV, (H) SWCNTs + IAV. The bottom panels are magnified images of SAEC probed with MAA after exposure to (I) SWCNTs and (J) IAV. Scale bars represent 50 μm. The cell nuclei are stained blue while the receptors are brown in color.
