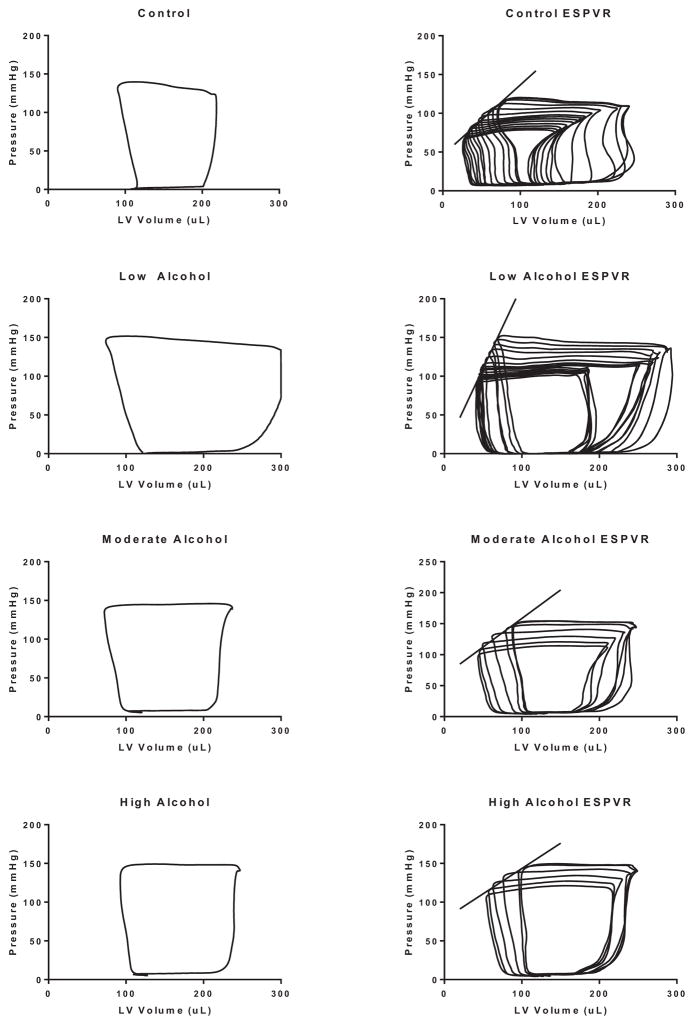
Fig. 10.
Effects of acute low alcohol (LA), moderate alcohol (MA), or high alcohol (HA) exposures on pressure–volume (PV) relationships of the left ventricle of adult male rats. Left panel: representative steady-state PV loop for control heart (first row), LA-exposed heart (second row),MA-exposed heart (third row), and HA-exposed heart (fourth row). Right panel: representative regression of PV loops following occlusion of the vena cava where the slope of the regression line depicts the end-systolic PV relationship (ESPVR) for each condition, respectively.

