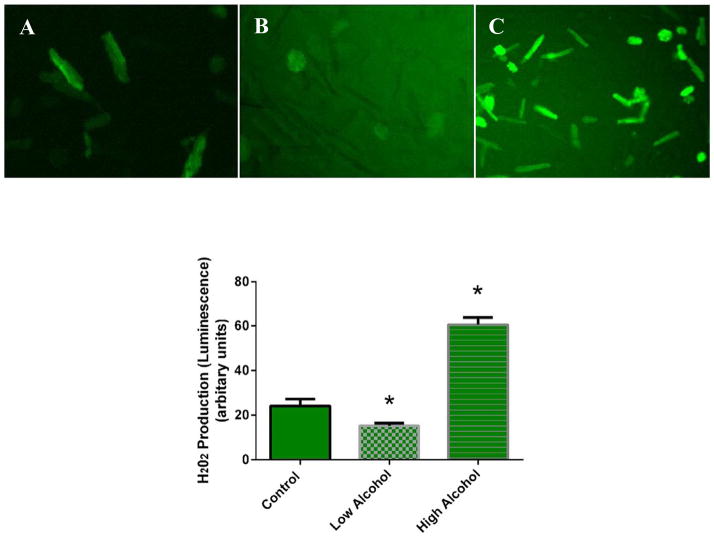
Fig. 9.
Qualitative images of cardiomyocytes exhibiting reactive oxygen species (ROS) production. Fluorescent images were captured at the maximal signal with each alcohol exposure: (A) control, (B) low alcohol, and (C) high alcohol. The peak of fluorescence occurred within 1 to 2 minutes after exposure to different amounts of alcohol. (D) Quantitative analysis of the maximal signal with each alcohol exposure. Bars represent mean values ± SEM (n = 6; *p < 0.05 compared with control).

