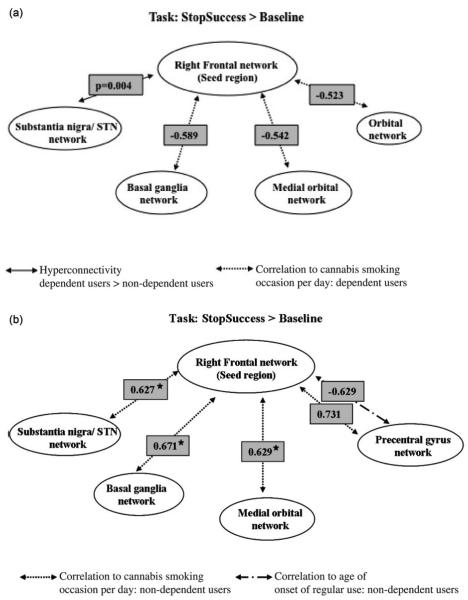
Figure 1.
Connectivity in inhibitory control networks during response inhibition (StopSuccess>baseline). Path diagrams illustrating the connections between the right frontal control network and StopSuccess network ROIs for cannabis-dependent and nondependent groups. The presence of between-group differences (p) and correlations (r) with cannabis use measures are indicated for (a) dependent and (b) nondependent groups. Networks that did not show either a significant group difference or correlation with behavior are not represented in these figures. *Significant at Bonferroni corrected threshold of FWE p<0.007 (with SVC).

