
Figure 2.
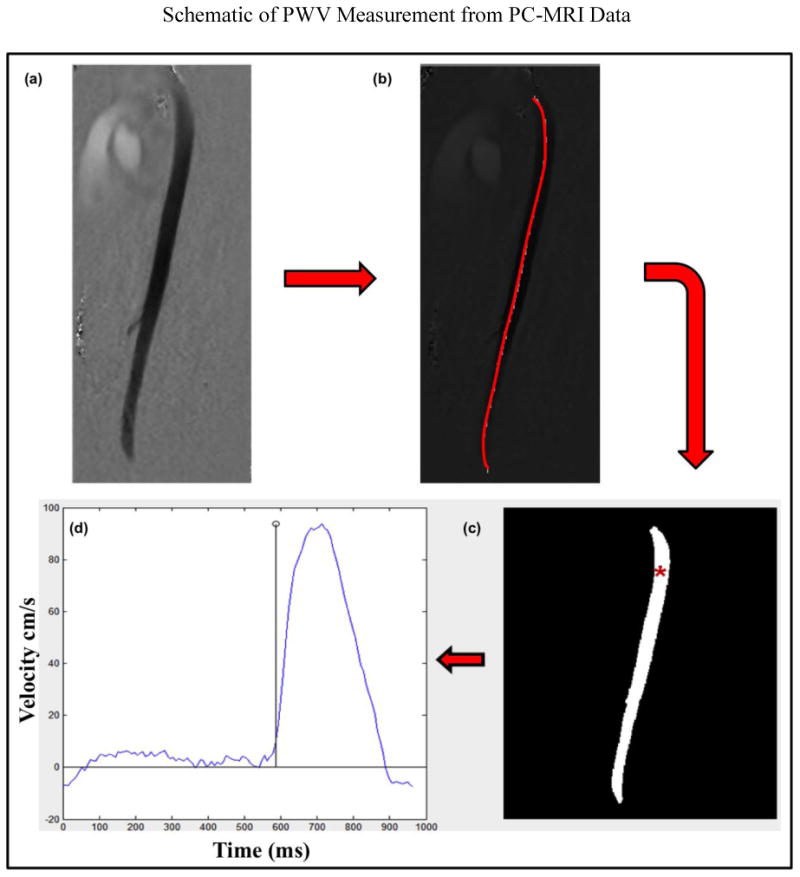
Shows the steps involved to estimate the PWV. (a) PC-MRI phase image at a particular phase of the cardiac cycle. (b) The red line indicates the major portion of the aorta that has been selected in the phase images of the PC-MRI data to determine the PWV. (c) Shows the foot of the velocity profile being tracked in the aorta with red asterisk showing an example at one of the locations. (d) Shows corresponding velocity profile at the asterisk location in one of the volunteers.