
Figure 3.
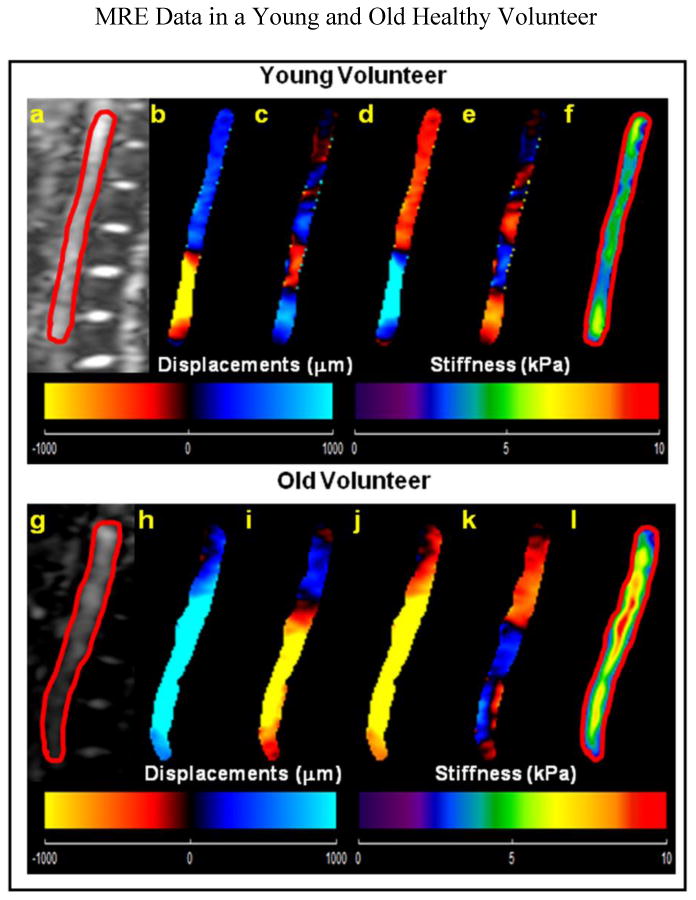
(a, g) Sagittal magnitude image with contour (red line) delineating the abdominal aorta in a young and in an old healthy volunteer respectively. Young Healthy Volunteer: (b–e): Snapshots of the four phases of the propagating waves. (f): The weighted stiffness map from x, y, and z encoding directions with a mean shear stiffness of 4.0±0.9 kPa. Old Healthy Volunteer: (h–k): Snapshots of the four phases of the propagating waves. (l): The weighted stiffness map from x, y, and z encoding directions with a mean shear stiffness of 7.4±2.1 kPa.