
Figure 4.
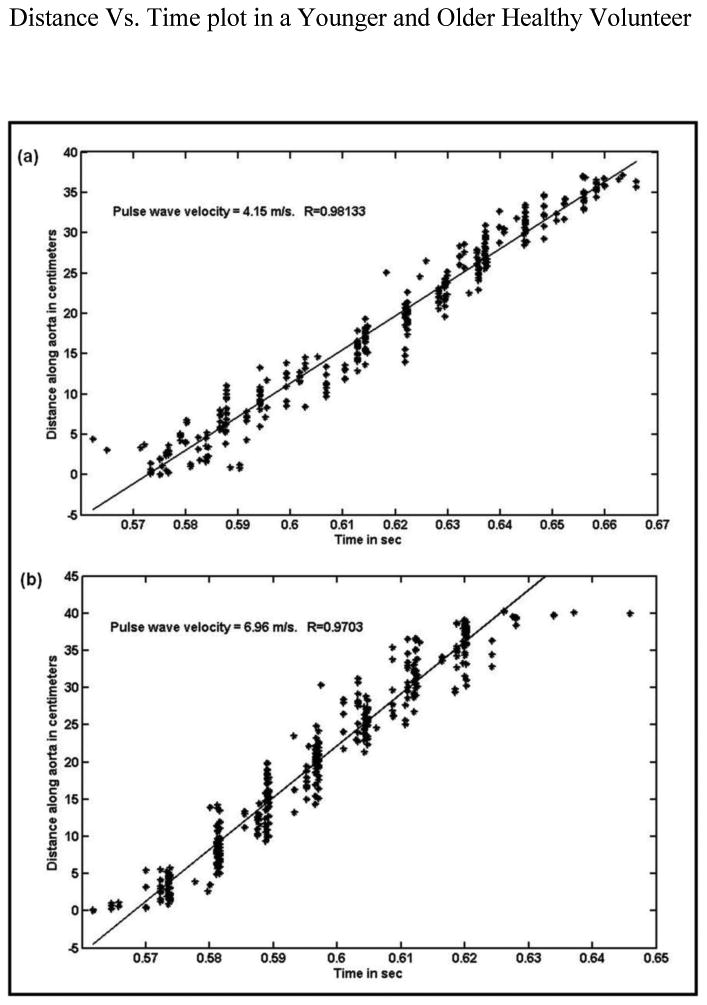
Plots of distance along the aorta (where foot of the velocity profile is tracked from one location to the other) as a function of time. (a) The slope from the plot provides PWV of 4.15m/s in a young healthy volunteer. (b): The slope from the plot provides PWV of 6.96m/s in an older healthy volunteer.