
Figure 5.
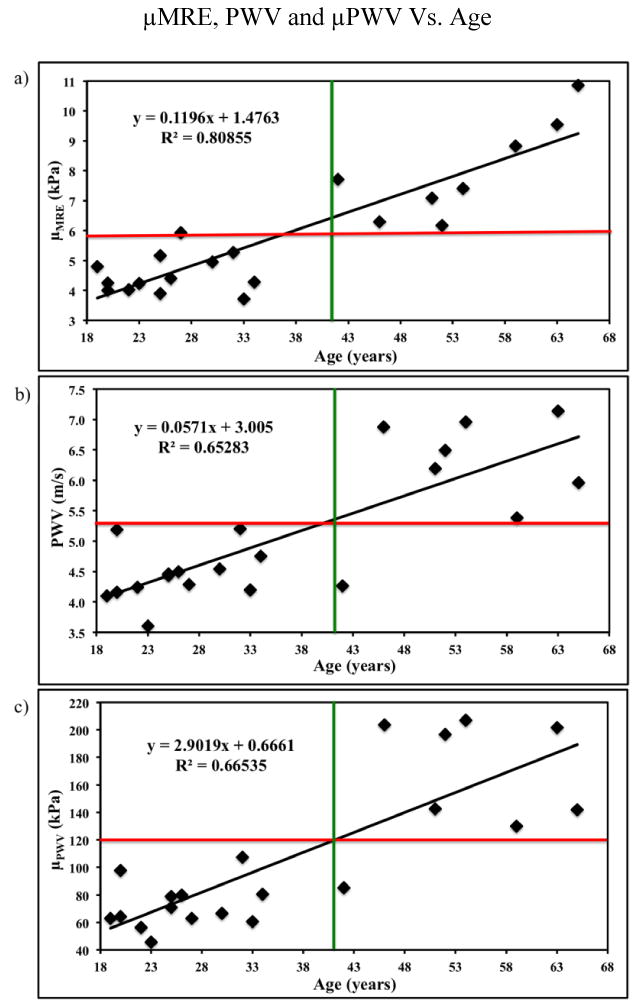
(a) Plot of MRE-derived stiffness (μMRE) as a function of age with a linear correlation of R2 value of 0.81. (b) Plot of MRI-based PWV as a function of age with a linear correlation of R2 value of 0.65. (c) Plot of the PWV based stiffness (μPWV) as a function of age with a linear correlation of R2 value of 0.67. The red and green lines show clear separation of stiffness measurements between young and old healthy volunteers.