
Figure 8.
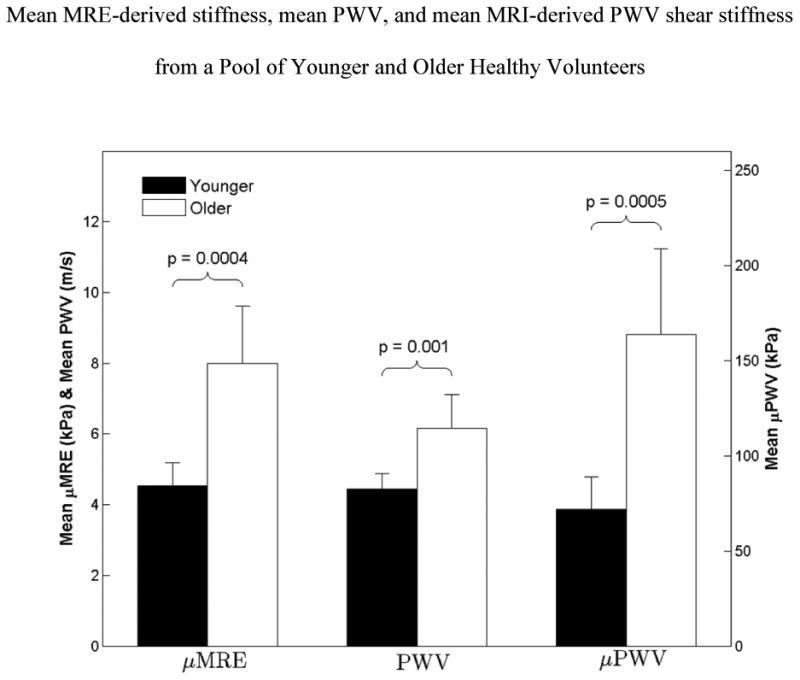
Box plot of mean MRE-derived shear stiffness (μMRE), mean PWV, and mean MRI-derived PWV shear stiffness (μPWV), from all young and old healthy volunteers with error bars representing one standard deviation. The mean μMRE measurement from all young healthy volunteers is significantly lower (p=0.0004) than that of old healthy volunteers. Similarly, the mean PWV and mean μPWV showed a significant difference of p≤0.001 between young and old healthy volunteers.